
Videos
A clinical trial was conducted to test the efficacy of nifedipine, a new drug for reducing chest pain in patients with angina severe enough to require hospitalization. The duration of the study was 14 days in the hospital unless the patient was withdrawn prematurely from therapy, was discharged from the hospital, or died prior to this time. Patients were randomly assigned to either nifedipine or propranolol and were given the same dosage of each drug in identical capsules at level 1 of therapy. If pain did not cease at this level of therapy or if pain recurred after a period of pain cessation, then the patient progressed to level 2, whereby the dosage of each drug was increased according to a pre-specified schedule. Similarly, if pain continued or recurred at level 2, then the patient progressed to level 3, whereby the dosage of the anginal drug was increased again. Patients randomized to either group received nitrates in any amount deemed clinically appropriate to help control pain.
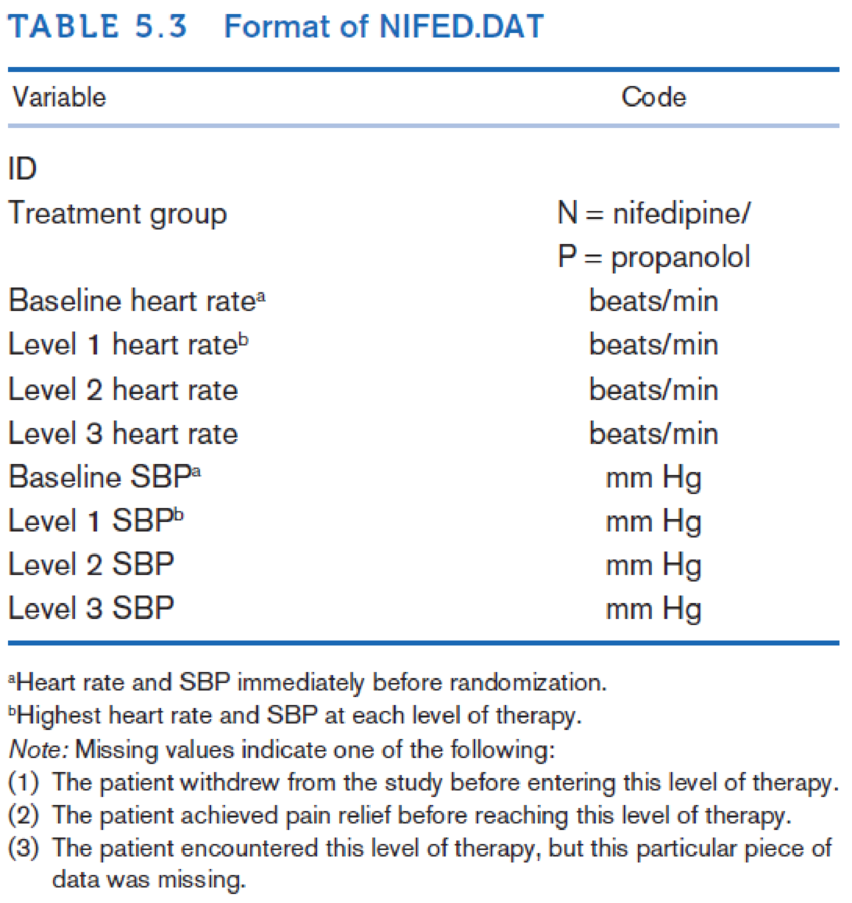
The main objective of the study was to compare the degree of pain relief with nifedipine vs. propranolol. A secondary objective was to better understand the effects of these agents on other physiologic parameters, including heart rate and blood pressure. Data on these latter parameters are given in Data Set NIFED.DAT (at www.cengagebrain.com); the format of this file is shown in Table 5.3
Compare graphically the effects of the treatment regimens on heart rate and blood pressure. Do you notice any difference between treatments?
Want to see the full answer?
Check out a sample textbook solution
Chapter 5 Solutions
Fundamentals of Biostatistics


- The authors of the article "Adjuvant Radiotherapy and Chemotherapy in Node-Positive Premenopausal Women with Breast Cancer"† reported on the results of an experiment designed to compare treating cancer patients with chemotherapy only to treatment with a combination of chemotherapy and radiation. Of the 154 individuals who received the chemotherapy-only treatment, 76 survived at least 15 years, whereas 98 of the 164 patients who received the hybrid treatment survived at least that long. With p1 denoting the proportion of all such women who, when treated with just chemotherapy, survive at least 15 years and p2 denoting the analogous proportion for the hybrid treatment, p̂1 = (rounded to three decimal places) and p̂2 = (rounded to three decimal places). A confidence interval for the difference between proportions based on the traditional formula with a confidence level of approximately 99% is 0.494 − 0.598 ± (2.58) (0.494)(0.506) 154 + (0.598)(0.402) 164…arrow_forwardA researcher conducted a medical study to investigate whether taking a low-dose aspirin reduces the chance of developing colon cancer. As part of the study, 1,000 adult volunteers were randomly assigned to one of two groups. Half of the volunteers were assigned to the experimental group that took a low-dose aspirin each day, and the other half were assigned to the control group that took a placebo each day. At the end of six years, 15 of the people who took the low-dose aspirin had developed colon cancer and 26 of the people who took the placebo had developed colon cancer. At the significance level α = 0.05, do the data provide convincing statistical evidence that taking a low-dose aspirin each day would reduce the chance of developing colon cancer among all people similar to the volunteers?arrow_forwardA simple random sample of front-seat occupants involved in car crashes is obtained. Among3000occupants not wearing seat belts,36were killed. Among 7697occupants wearing seat belts,18were killed. Use a0.05significance level to test the claim that seat belts are effective in reducing fatalities. Complete parts (a) through (c) below.arrow_forward
- A heart study objective was to study heart disease among healthy volunteers.After a 10-year follow-up period involving men aged 40 to 59, there were 16 casesof coronary heart disease (CHD) among the 454 men who initially had cholesterollevels below 210 mg/100 ml (referred to as the low serum cholesterol group). Incontrast, among the 424 men whose initial cholesterol levels were at least 245mg/100 ml (referred to as the high serum cholesterol group), there were 51 cases ofCHD. With this information, Draw a 2x2 contingency table then calculate the relative risk (RR) associated with high serum cholesterol and provide an interpretation of the result.arrow_forwardA large manufacturing company investigated the service it received from its suppliers and discovered that, in the past, 38% of all material shipments were received late. However, the company recently installed a just-in-time system in which suppliers are linked more closely to the manufacturing process. A random sample of 150 deliveries since the just-in-time system was installed reveals that 33 deliveries were late. If we want to test whether the proportion of late deliveries was reduced signicantly at = 0:10 the null and alternative hypotheses are a. Null hypothesis (H0) b. Alternative hypothesis (HA)arrow_forward31% of all pygmy softshell tortoises have stripes on their shells. A herpetologist in Cititon collects a sample of 28 pygmy softshell tortoises and finds that 8 of them have stripes on their shells. Is there enough evidence to conclude, at a significance of alpha = 0.05, that the proportion of pygmy softshell tortoises in Cititon with stripes on their shells is less than 31%? What is the claim? What is the null hypothesis? What is the alternative hypothesis? What is the test statistic? What is/are the critical value(s)? Do we reject the null hypothesis? What conclusion do we draw? What is the P-value for the problem above?arrow_forward
- Suppose a researcher is interested inthe effectiveness in a new childhood exercise program implemented in a SRS of schools across a particular county. In order to test the hypothesis that the new program decreases BMI (Kg/m2), the researcher takes a SRS of children from schools where the program is employed and a SRS from schools that do not employ the program and compares the results. Assume the following table represents the SRSs of students and their BMIs. Student intervention group BMI (kg/m2) Student control group BMI (kg/m2) A 18.6 A 21.6 B 18.2 B 18.9 C 19.5 C 19.4 D 18.9 D 22.6 E 24.1 F 23.6 A) Assuming that all the necessary conditions are met (normality, independence, etc.) carry out the appropriate statistical test to determine if the new exercise program is effective. Use an alpha level of 0.05. Do not assume equal variances.B) Construct a 95% confidence interval about your estimate for the average difference in BMI between the groups.arrow_forwardA study was performed on 200 elementary school students to investigate whether regular Vitamin A supplementation was effective in preventing colds during the month of March. 100 were randomized to receive daily Vitamin A supplements during the month of March, and 100 students were randomized to a placebo group (and did not receive Vitamin A) during the same month. The number of students getting at least one cold in March was computed in the two groups, and the results are given in the following 2 X 2 table. Using a 5% level of significance determine whether there is an association between Vitamin A supplementation and prevention of Common Cold ColdNo Cold Vitamin A1585100 Placebo2575100 40160200arrow_forwardA consumer advocacy group wanted to study whether different airline carriers differed in terms of their delayed flights. In particular, the researchers were interested in the relationship between p1, the proportion of Alpha Airlines flights that were delayed at least 15 minutes, and p2, the proportion of Beta Airlines flights that were delayed at least 15 minutes. A random sample of 1,000 Alpha flights and a separate random sample of 1,000 Beta flights found that 67 of the Alpha fights and 160 of the Beta flights were delayed at least 15 minutes. The conditions for inference were checked and verified. Does this set of samples provide strong evidence that Alpha Airlines has a smaller proportion of flights that are delayed at least 15 minutes than Beta Airlines, at the α = 0.05 significance level? Find the z-table here. A. The test statistic is z = –6.56 and the P-value ≈ 0. Since the P-value ≈ 0 < 0.05, there is not sufficient evidence that Alpha Airlines has fewer delayed…arrow_forward
- A 1980 study investigated the relationship between the use of OCs and the development of endometrial cancer. The researchers found that of 117 endometrial-cancer patients, 6 had used the OC Oracon at some time in their lives, whereas 8 of the 395 controls had used this agent. Test for an association between the use of Oracon and the incidence of endometrial cancer, using a two-tailed test.arrow_forwardA low-level CDC bureaucrat wants to please his boss by gathering evidence thatthe current government-mandated shutdown of society is not causing people’s mentalhealth to deteriorate, so that it can safely be continued for several years if anyexpert says it’s necessary.He polls a random sample of 1600 citizens, gathering data on such items asincome loss, weight gain, access to toilet paper, hours spent binge-watchingNetflix, and number of injuries caused by household fights, and compiles all thisinto a scientifically-weighted “misery index”.The mean misery index from the sample is 99.2; it seems reasonable to use apopulation standard deviation σ = 19.1.a) Does this information provide significant evidence (at the 5% level) that thenationwide mean misery index is less than 100? Set up appropriate null andalternative hypotheses, calculate the appropriate test statistic, find the P-value,and state your conclusion. (10)b) A CDC press release publishing the results of this study claims that…arrow_forwardA low-level CDC bureaucrat wants to please his boss by gathering evidence thatthe current government-mandated shutdown of society is not causing people’s mentalhealth to deteriorate, so that it can safely be continued for several years if anyexpert says it’s necessary.He polls a random sample of 1600 citizens, gathering data on such items asincome loss, weight gain, access to toilet paper, hours spent binge-watchingNetflix, and number of injuries caused by household fights, and compiles all thisinto a scientifically-weighted “misery index”.The mean misery index from the sample is 99.2; it seems reasonable to use apopulation standard deviation σ = 19.1.a) Does this information provide significant evidence (at the 5% level) that thenationwide mean misery index is less than 100? Set up appropriate null andalternative hypotheses, calculate the appropriate test statistic, find the P-value,and state your conclusion. b) A CDC press release publishing the results of this study claims that…arrow_forward
 Holt Mcdougal Larson Pre-algebra: Student Edition...AlgebraISBN:9780547587776Author:HOLT MCDOUGALPublisher:HOLT MCDOUGAL