
Concept explainers
Videos
The accompanying data on y 5 energy output (W) and x 5 temperature difference (°K) was provided by the authors of the article “Comparison of Energy and Exergy Efficiency for Solar Box and Parabolic Cookers” (J. of Energy Engr., 2007: 53–62). The article’s authors fit a cubic regression model to the data. Here is Minitab output from such a fit.
| x | 23.20 | 23.50 | 23.52 | 24.30 | 25.10 | 26.20 | 27.40 | 28.10 | 29.30 | 30.60 | 31.50 | 32.01 |
| y | 3.78 | 4.12 | 4.24 | 5.35 | 5.87 | 6.02 | 6.12 | 6.41 | 6.62 | 6.43 | 6.13 | 5.92 |
| x | 32.63 | 33.23 | 33.62 | 34.18 | 35.43 | 35.62 | 36.16 | 36.23 | 36.89 | 37.90 | 39.10 | 41.66 |
| y | 5.64 | 5.45 | 5.21 | 4.98 | 4.65 | 4.50 | 4.34 | 4.03 | 3.92 | 3.65 | 3.02 | 2.89 |
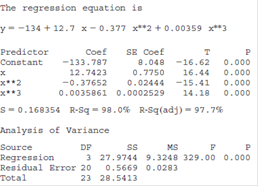
a. What proportion of observed variation in energy output can be attributed to the model relationship?
b. Fitting a quadratic model to the data results in R2 = .780. Calculate adjusted R2 for this model and compare to adjusted R2 for the cubic model.
c. Does the cubic predictor appear to provide useful information about y over and above that provided by the linear and quadratic predictors? State and test the appropriate hypotheses.
d. When x = 30,
e. Interpret the hypotheses

Trending nowThis is a popular solution!

Chapter 13 Solutions
Probability and Statistics for Engineering and the Sciences


- The following fictitious table shows kryptonite price, in dollar per gram, t years after 2006. t= Years since 2006 0 1 2 3 4 5 6 7 8 9 10 K= Price 56 51 50 55 58 52 45 43 44 48 51 Make a quartic model of these data. Round the regression parameters to two decimal places.arrow_forwardSuppose that researchers are interested in determining the bi-annual salary of statisticians of different levels using their years of experience and their education level (M = bachelors, P = doctorate). They fit the following model to a dataset that includes these variables and, after performing the proper steps of multiple linear regression, the following multiple linear regression model is obtained: yˆ = 42308 + 323x1 + 213x2 + 301(x1*x2) where the variables are as follows: yˆ = predicted bi−annual salary in dollars, x1 = number of years of experiencex2= {1 if the education level is a doctorate 0 if the education level is a bachelors What is the predicted bi-annual starting salary of an employee with a doctorate degree? (Someone with no work experience). $ What is the predicted bi-annual starting salary of an employee with a bachelor’s degree? (Someone with no work experience). $arrow_forwardThe table below shows the number of state-registered automatic weapons and the murder rate for several Northwestern states. xx 11.7 8.3 7 3.4 2.4 2.6 2.6 0.9 yy 14 11.1 10.1 6.7 6.1 6.4 6.5 4.9 xx = thousands of automatic weaponsyy = murders per 100,000 residents Determine the regression equation in y = ax + b form and write it below. (Round to 2 decimal places):____________________ A) How many murders per 100,000 residents can be expected in a state with 10.8 thousand automatic weapons? Round to 3 decimal places. Answer = B) How many murders per 100,000 residents can be expected in a state with 4.4 thousand automatic weapons? Round to 3 decimal places. Answer =arrow_forward
- Snowpacks contain a wide spectrum of pollutants thatmay represent environmental hazards. The article“Atmospheric PAH Deposition: Deposition Velocitiesand Washout Ratios” (J. of EnvironmentalEngineering, 2002: 186–195) focused on the depositionof polyaromatic hydrocarbons. The authors proposeda multiple regression model for relating depositionover a specified time period (y, in mg/m2) to tworather complicated predictors x1 (mg-sec/m3) and x2 (mg/m2), defined in terms of PAH air concentrations forvarious species, total time, and total amount of precipitation.Here is data on the species fluoranthene andcorresponding Minitab output:obs x1 x2 flth1 92017 .0026900 278.782 51830 .0030000 124.533 17236 .0000196 22.654 15776 .0000360 28.685 33462 .0004960 32.666 243500 .0038900 604.707 67793 .0011200 27.698 23471 .0006400 14.189 13948 .0004850 20.6410 8824 .0003660 20.6011 7699 .0002290 16.6112 15791 .0014100 15.0813 10239 .0004100 18.0514 43835 .0000960 99.7115 49793 .0000896 58.9716 40656…arrow_forwardThe table contains data on vehicle speed (h) and fuel consumption (lt / 100km) of 5 randomly selected vehicles. Estimate the average fuel consumption of a vehicle traveling at 45 km / h using the simple linear regression equation between vehicle speed and fuel consumption. Speed 55 60 65 70 75 Consumption 13 12 11 10 9 a. 15 b. 8 c. 7 d. 20arrow_forwardThe following estimated regression model was developed relating yearly income (y in $1000s) of 30 individuals with their age (x1) and their gender (x2) (0 if male and 1 if female).ŷ = 30 + 0.7x1 + 3x2Also provided are SST = 1200 and SSE = 384.The yearly income of a 24-year-old female individual is _____.arrow_forward
- A U.S. state's Bureau of Economic Geology published a study on the economic impact of using carbon dioxide enhanced oil recovery (EOR) technology to extract additional oil from fields that have reached the end of their conventional economic life. The following table gives the approximate number of jobs for the citizens that would be created at various levels of recovery. Percent Recovery (%) 20 40 80 100 Jobs Created (Millions) 6 9 12 18 Find the regression line. j(r) = Use the regression line to estimate the number of jobs that would be created at a recovery level of 60%. _____ million jobsarrow_forwardWe have been assigned to determine how the total weeklyproduction cost for Widgetco depends on the number ofwidgets produced during the week. The following modelhas been proposed:Y b0 b1X b2X2 b3X3 where X number of widgets produced during the weekand Y total production cost for the week. For 15 weeksof data, we found that SSR 215,475 and SST 229,228.For this model, we obtain the following estimated regressionequation (t-statistics for each coefficient are in parentheses):yˆ 29.7 19.8X 0.39X2 0.005X3(0.78) (0.62) (1.25)a For a 0.10, test H0: bi 0 against Ha: bi 0(i 1, 2, 3).b Determine R2 for this model. How can the high R2value be reconciled with the answer to part (a)?arrow_forwardGiven are five observations collected in a regression study on two variables. xi 2 6 9 13 20 yi 7 18 9 26 23 Compute b0 and b1 (to 1 decimal).b1 b0 Complete the estimated regression equation (to 1 decimal).^y = + x Use the estimated regression equation to predict the value of y when x = 6 (to 1 decimal).^y =arrow_forward
- Refer to the following computer output from estimating the parameters of the nonlinear model Y = aRbScTd The computer output from the regression analysis is: DEPENDENT VARIABLE: LNY R-SQUARE F-RATIO P-VALUE ON F OBSERVATIONS: 32 0.7766 32.44 0.0001 VARIABLE PARAMETER ESTIMATE STANDARD ERROR T-RATIO P-VALUE INTERCEPT -0.6931 0.32 -2.17 0.0390 LNR 4.66 1.36 3.43 0.0019 LNS -0.44 0.24 -1.83 0.0774 LNT 8.28 4.60 1.80 0.0826 Based on the information in the table, if R = 1, S = 2, and T = 3, what value do you expect Y will have?arrow_forwardRefer to the following computer output from estimating the parameters of the nonlinear model Y = aRbScTd The computer output from the regression analysis is: DEPENDENT VARIABLE: LNY R-SQUARE F-RATIO P-VALUE ON F OBSERVATIONS: 32 0.7766 32.44 0.0001 VARIABLE PARAMETER ESTIMATE STANDARD ERROR T-RATIO P-VALUE INTERCEPT -0.6931 0.32 -2.17 0.0390 LNR 4.66 1.36 3.43 0.0019 LNS -0.44 0.24 -1.83 0.0774 LNT 8.28 4.60 1.80 0.0826 Based on the information in the table, if S increases by 8% (all other things constant), Y will Multiplearrow_forwardRefer to the following computer output from estimating the parameters of the nonlinear model Y = aRbScTd The computer output from the regression analysis is: DEPENDENT VARIABLE: LNY R-SQUARE F-RATIO P-VALUE ON F OBSERVATIONS: 32 0.7766 32.44 0.0001 VARIABLE PARAMETER ESTIMATE STANDARD ERROR T-RATIO P-VALUE INTERCEPT -0.6931 0.32 -2.17 0.0390 LNR 4.66 1.36 3.43 0.0019 LNS -0.44 0.24 -1.83 0.0774 LNT 8.28 4.60 1.80 0.0826 Based on the information in the table, which of the parameter estimates are statistically significant at the 90% level of confidence?arrow_forward
 Functions and Change: A Modeling Approach to Coll...AlgebraISBN:9781337111348Author:Bruce Crauder, Benny Evans, Alan NoellPublisher:Cengage Learning
 Algebra & Trigonometry with Analytic GeometryAlgebraISBN:9781133382119Author:SwokowskiPublisher:Cengage