
Videos
An experiment to investigate the effects of a new technique for degumming of silk yarn was described in the article “Some Studies in Degumming of Silk with Organic Acids” (J. Society of Dyers and Colourists, 1992: 79–86). One response variable of interest was y = weight loss (%). The experimenters made observations on weight loss for various values of three independent variables: x1 = temperature (°C) = 90, 100, 110;x2 = time of treatment (min) = 30, 75, 120; x3 = tartaric acid concentration (g/L) = 0,8,16. In the regression analyses, the three values of each variable were coded as −1, 0, and 1, respectively, giving the accompanying data (the value y8 = 19.3 was reported, but our value y8 = 20.3 results in regression output identical to that appearing in the article).
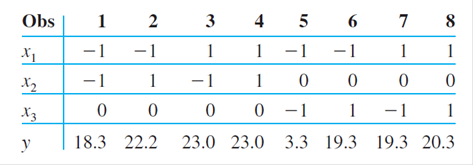
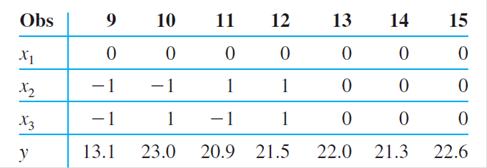
A multiple regression model with k = 9 predictors—x1, x2, x3,
a. Does this model specify a useful relationship? State and test the appropriate hypotheses using a significance level of .01.
b. The estimated standard deviation of
c. Calculate a 95% PI for a single weight-loss value to be observed when temperature, time, and concentration have values 100, 75, and 8, respectively.
d. Fitting the model with only x1, x2, and x3 as predictors gave R2 = .456 and SSE = 203.82. Does at least one of the second-order predictors provide additional useful information? State and test the appropriate hypotheses.
Want to see the full answer?
Check out a sample textbook solution
Chapter 13 Solutions
Probability and Statistics for Engineering and the Sciences


- Stressed-Out Bus Drivers. Previous studies have shown that urban bus drivers have an extremely stressful job, and a large proportion of drivers retire prematurely with disabilities due to occupational stress. In the paper, “Hassles on the Job: A Study of a Job Intervention With Urban Bus Drivers” (Journal of Organizational Behavior, Vol. 20, pp. 199–208), G. Evans et al. examined the effects of an intervention program to improve the conditions of urban bus drivers.Amongother variables, the researchers monitored diastolic blood pressure of bus drivers in downtown Stockholm, Sweden. The data, in millimeters of mercury (mm Hg), on the WeissStats site are based on the blood pressures obtained prior to intervention for the 41 bus drivers in the study. Use the technology of your choice to do the following. a. Obtain a normal probability plot, boxplot, histogram, and stemand-leaf diagram of the data. b. Based on your results from part (a), can you reasonably apply the one-mean t-test to the…arrow_forwardConsider a regression analysis with n = 47 and three potential independent variables. Suppose that one of the independent variables has a correlation of 0.95 with the dependent variable. Does this imply that this independent variable will have a very large Student’s t statistic in the regression analysis with all three predictor variables?arrow_forwardCompare the two separate scatterplots. In particular, how do the associtation compare between women with pets vs. women without pets? Does one group have more variation in systolic blood pressure than the other? If so, for which group? Does systolic blood pressure seem higher for common ages between the two groups? If so, for which group?arrow_forward
- Suppose a researcher is interested inthe effectiveness in a new childhood exercise program implemented in a SRS of schools across a particular county. In order to test the hypothesis that the new program decreases BMI (Kg/m2), the researcher takes a SRS of children from schools where the program is employed and a SRS from schools that do not employ the program and compares the results. Assume the following table represents the SRSs of students and their BMIs. Student intervention group BMI (kg/m2) Student control group BMI (kg/m2) A 18.6 A 21.6 B 18.2 B 18.9 C 19.5 C 19.4 D 18.9 D 22.6 E 24.1 F 23.6 A) Assuming that all the necessary conditions are met (normality, independence, etc.) carry out the appropriate statistical test to determine if the new exercise program is effective. Use an alpha level of 0.05. Do not assume equal variances.B) Construct a 95% confidence interval about your estimate for the average difference in BMI between the groups.arrow_forward1. What is the most important predictor in terms of contribution to the dependent variable? 2. Which of the following is not a significant predictor at 5%? 3. Which of the following is the best predictor?arrow_forwardRecently, researchers have begun to focus on the relationship between potentially toxic environmental exposures in children to a number of adverse health outcomes. Suppose one such researcher wants to investigate the relationship between lead levels in soil (micrograms/dL) and BMI (kg/m2). The following table represents a SRS of households with the corresponding exterior lead levels and BMI of a randomly sampled child in the home. Lead levels BMI 13.6 19.7 14.3 19.9 9.7 20.1 9.4 22.1 11.4 19.8 10.9 21.6 A) Write out the null and alternative hypotheses for a formal test of significance testing the correlation between the two variables and calulate a t statistic and interpret your pvalue and results.arrow_forward
- A Canadian study measuring depression level in teens (as reported in the Journal of Adolescence, vol. 25, 2002) randomly sampled 112 male teens and 101 female teens, and scored them on a common depression scale (higher score representing more depression). The researchers suspected that the mean depression score for male teens is higher than for female teens, and wanted to check whether data would support this hypothesis. If μ1 and μ2 represent the mean depression score for male teens and female teens respectively, which of the following is an appropriate pair of hypotheses in this case? Check all that apply.arrow_forwardQ3. Kaimura et al. (2000) investigated the effects of procyanidin B-2 tonic on human hair growth after sequential use for 6 months. In one part of the study, the total hair increase (total hairs at month 6 – total hairs at month 0) in the designated scalp area was measured for a sample of 15 men treated with a placebo control and a sample of 25 men treated with a procyanidin B-2 (PB2). The data is contained in the file A2Q3.csv. (This data is simulated based on information in the paper. You must use the data in the file to carry out the analysis). Is there evidence that the total hair increase of the subjects in the procyanidin B-2 group was greater the those in the placebo control group, at the 5% level of significance? State an appropriate null and alternative hypothesis in words and symbols.arrow_forwardA deficiency of the trace element selenium in the diet can negatively impact growth, immunity, muscle and neuromuscular function, and fertility. The introduction of selenium supplements to dairy cows is justified when pastures have low selenium levels. Authors of a research paper supplied the following data on milk selenium concentration (mg/L) for a sample of cows given a selenium supplement (the treatment group) and a control sample given no supplement, both initially and after a 9-day period. Initial Measurement Treatment Control 11.2 9.1 9.6 8.7 10.1 9.7 8.5 10.8 10.3 10.9 10.6 10.6 11.7 10.1 9.7 12.3 10.8 8.8 10.3 10.4 10.4 10.9 11.2 10.4 9.4 11.6 10.6 10.9 10.7 8.4 After 9 Days Treatment Control 138.3 9.3 104 8.7 96.4 8.7 89 10.1 88 9.6 103.8 8.6 147.3 10.2 97.1 12.2 172.6 9.3 146.3 9.5 99 8.2 122.3 8.9 103 12.5 117.8 9.1 121.5 93 (a) Use the given data for the treatment group to determine if there…arrow_forward
- A deficiency of the trace element selenium in the diet can negatively impact growth, immunity, muscle and neuromuscular function, and fertility. The introduction of selenium supplements to dairy cows is justified when pastures have low selenium levels. Authors of a research paper supplied the following data on milk selenium concentration (mg/L) for a sample of cows given a selenium supplement (the treatment group) and a control sample given no supplement, both initially and after a 9-day period. Initial Measurement Treatment Control 11.3 9.1 9.7 8.7 10.1 9.7 8.5 10.8 10.4 10.9 10.7 10.6 11.8 10.1 9.8 12.3 10.6 8.8 10.4 10.4 10.2 10.9 11.3 10.4 9.2 11.6 10.7 10.9 10.8 8.2 After 9 Days Treatment Control 138.3 9.4 104 8.8 96.4 8.8 89 10.1 88 9.7 103.8 8.7 147.3 10.3 97.1 12.3 172.6 9.4 146.3 9.5 99 8.3 122.3 8.9 103 12.5 117.8 9.1 121.5 93 (a) Use the given data for the treatment group to determine if…arrow_forwardA deficiency of the trace element selenium in the diet can negatively impact growth, immunity, muscle and neuromuscular function, and fertility. The introduction of selenium supplements to dairy cows is justified when pastures have low selenium levels. Authors of a research paper supplied the following data on milk selenium concentration (mg/L) for a sample of cows given a selenium supplement (the treatment group) and a control sample given no supplement, both initially and after a 9-day period. Initial Measurement Treatment Control 11.4 9.1 9.6 8.7 10.1 9.7 8.5 10.8 10.2 10.9 10.6 10.6 11.9 10.1 9.9 12.3 10.7 8.8 10.2 10.4 10.3 10.9 11.4 10.4 9.3 11.6 10.6 10.9 10.9 8.3 After 9 Days Treatment Control 138.3 9.2 104 8.9 96.4 8.9 89 10.1 88 9.6 103.8 8.6 147.3 10.4 97.1 12.4 172.6 9.2 146.3 9.5 99 8.4 122.3 8.8 103 12.5 117.8 9.1 121.5 93 (a) Use the given data for the treatment group to determine if…arrow_forwardThe Road Department is trying to see whether they should buy road treatments ( in tons) for storms based on the number of inches of snow for each recorded. Use Pearson r at alpha- 0.05 to test the hypothesis. ILLUSTRATE THE NORMAL CURVE inches in snow 1.5 1.7 3.7 2.8 4.6 2.4 3.1 2.9 3.6 4.2 3.1 number of tons 805 905 1235 1000 1302 998 1102 1305 1456 1600 1005arrow_forward
 Glencoe Algebra 1, Student Edition, 9780079039897...AlgebraISBN:9780079039897Author:CarterPublisher:McGraw Hill