
Videos
The article “The Influence of Honing Process Parameters on Surface Quality, Productivity, Cutting Angle, and Coefficient of Friction” (Industrial Lubrication and Tribology, 2012: 77–83) included the following data on x1 = cutting speed (m/s), x2 = specific pressure of pre-honing process (N/mm2), x3 = specific pressure of finishing honing process, and y = productivity in the honing process (mm3/s for a particular tool; productivity is the volume of the material cut in a second.
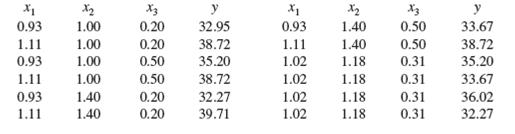
a. The article proposed a multivariate power model
Carry out the model utility test at significance level .05.
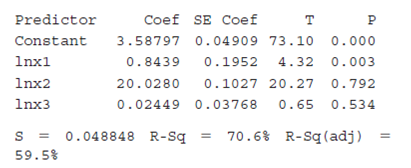
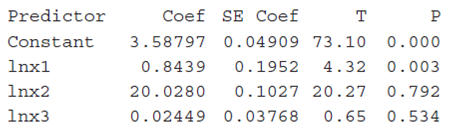
b. The large P-value corresponding to the t ratio for ln(x2) suggests that this predictor can be eliminated from the model. Doing so and refitting yields the following Minitab output.
S = 0.048848 R-Sq = 70.6% R-Sq(adj) = 59.5%
Given that ln(x1) remains in the model, should ln(x3) be retained?
c. Fit the simple linear regression model implied by your conclusion in (b) to the transformed data, and carry out a test of model utility.
d. The standardized residuals from the fit referred to in (c) are .03, .33. 1.69, .33, −.49, .96, .57, .33, −,25, −1.28, .29, −2.26. Plot these against ln(x1). What does the pattern suggest?
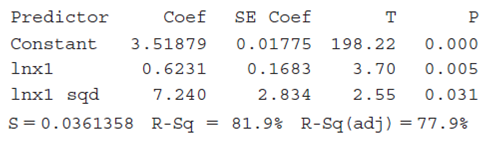
e. Fitting a quadratic regression model to relate ln(y) to ln(x1) gave the following Minitab output. Carry out a test of model utility at significance level .05 (the pattern in residual plots is satisfactory). Then use the fact that
Want to see the full answer?
Check out a sample textbook solution
Chapter 13 Solutions
Probability and Statistics for Engineering and the Sciences


- Find kurtosis using quartile deviation.arrow_forwardThe article “Monte Carlo Simulation—Tool for Better Understanding of LRFD” (J. of Structural Engr., 1993:1586–1599) suggests that yield strength (ksi) for A36 grade steel is normally distributed with a mean of 50.2 ksi and a standard deviation of 3.8 ksi. What is the probability that the yield strength is greater than 60? (Use 4 decimal places) Show the area of interest in the density curve.arrow_forwardAn urban community wants to show that the incidence of breast cancer is higher in their locality than in a neighboring rural area. (PCB levels were found to be higher in the soil of the urban community). If you find that in the urban community 20 out of 200 adult women have breast cancer and that in the rural community 10 out of 150 adult women have it, could you conclude, at a significance level of 0.05, that breast cancer is more prevalent in the urban community?1. The parameter of interest is:2. The hypotheses for this test are:3. The calculated test statistic is:4. The critical region is:5. Draw the critical region (make decision):6. It can be concluded that:arrow_forward
- It is known that the tensile strength of a plastic increases as a function of the time it is subjected to heat treatment. The table below shows the data of the plastic subjected to heat treatment. Determine these data by using the "lagrange interpolation" method by approximating the functions of the lagrange multipliers of L0 , L1 , L2 , L3 and L4 to a 4th order curve. Calculate the tensile strengths of 1.7321 and 2.2361 seconds for each lagrange factor in the function equations of the lagrange multipliers.arrow_forwardRefer to the data display from a sample of airport data speeds in Mbps. What is the number of degrees of freedom that should be used for finding the critical value ta/2 ?arrow_forwardWhat is the difference between the critical value of z and the observed value of z?arrow_forward
- An experiment to determine the effect of four different types of engine oil (A, B, C, and D) on the rolling friction coefficient of a car speed has been conducted. Three brands of car (Honda, Toyota, and Mazda) were chosen, and each engine oil was tested twice on each car, producing the following ANOVA output in Figure 2. i) How many treatments involved? Write down all the treatments ii) Identify the number of replication for each treatment. iii) Based on the ANOVA table above, find the values of W, X, Y and Z. iv) Test the interaction effect on rolling friction coefficient of car speed between the four different types of engine oil and the three different brands of car. v) Do we need to test for marginal effect? Give a reason.arrow_forwardDuring the spring of 1999, many fuel storage facilities in Serbia were destroyed by bombing. As a result, significant quantities of oil products were spilled and burned,resulting in soil pollution. The article “Mobility of Heavy Metals Originating from Bombing of Industrial Sites” (B. Škrbić, J. Novaković, and N. Miljević, Journal of Environmental Science and Health, 2002:7–16) reports measurements of heavy metal concentrations at several industrial sites in June 1999, just after the bombing, and again in March of 2000. At the Smederevo site, on the banks of the Danube River, eight soil specimens taken in 1999 had an average lead concentration (in mg/kg) of 10.7 with a standard deviation of 3.3. Four specimens taken in 2000 had an average lead concentration of 33.8 with a standard deviation of 0.50. Find a 95% confidence interval for the increase in lead concentration between June 1999 and March 2000.arrow_forwardAn article in Knee Surgery, Sports Traumatology, Arthroscopy (2005, Vol. 13, pp. 273-279) considered arthroscopic meniscal repair with an absorbable screw. Results showed that for tears greater than 25 millimeters, 14 of 18 (78%) repairs were successful, but for shorter tears, 22 of 30 (73%) repairs were successful. A doctor would like to know if there is evidence that the success rate is greater for longer tears. The P-value for the test H0: p1 = p2 versus H1: p1 > p2 is closest to:arrow_forward
- Poly(3-hydroxybutyrate) (PHB), a semicrystalline polymer that is fully biodegradable and biocompatible, is obtained from renewable resources. From a sustainability perspective, PHB offers many attractive properties though it is more expensive to produce than standard plastics. The accompanying data on melting point (°C) for each of 12 specimens of the polymer using a differential scanning calorimeter appeared in an article. 180.4 181.7 180.9 181.7 182.7 181.5 181.4 182.1 182.1 180.4 181.8 180.4 Compute the following. (Round your answer to two decimal places.) b. the sample variance s2 from the definition [Hint: First subtract 180 from each observation.] c. the sample standard deviation d. s2 using the shortcut methodarrow_forwardWhat is the Zstat and the Critical Value of the above question?arrow_forwardAt 5% level of significance, test if the Penicillium roqueforticolonies grown on malt extract agar are bigger than when grown on Czapek yeast autolysate agar using the given R-software output: Note: write Ho and Ha both in symbols and in words. Ho: Ha: Test procedure: Decision Rule: Computed test statistic and p-value: Decision: Conclusion:Data: The measurements of their diameters (mm.) are as follows: 38.6 39.0 35.2 34.1 32.9 42.4 37.5 52.6 45.9 60.0 29.1 47.7 61.7 41.7 43.5 50.2arrow_forward
 MATLAB: An Introduction with ApplicationsStatisticsISBN:9781119256830Author:Amos GilatPublisher:John Wiley & Sons Inc
 Probability and Statistics for Engineering and th...StatisticsISBN:9781305251809Author:Jay L. DevorePublisher:Cengage Learning
 Statistics for The Behavioral Sciences (MindTap C...StatisticsISBN:9781305504912Author:Frederick J Gravetter, Larry B. WallnauPublisher:Cengage Learning
 Elementary Statistics: Picturing the World (7th E...StatisticsISBN:9780134683416Author:Ron Larson, Betsy FarberPublisher:PEARSON
 The Basic Practice of StatisticsStatisticsISBN:9781319042578Author:David S. Moore, William I. Notz, Michael A. FlignerPublisher:W. H. Freeman
 Introduction to the Practice of StatisticsStatisticsISBN:9781319013387Author:David S. Moore, George P. McCabe, Bruce A. CraigPublisher:W. H. Freeman