
Videos
a)
To explain the shape of the distribution.
a)
Answer to Problem 10E
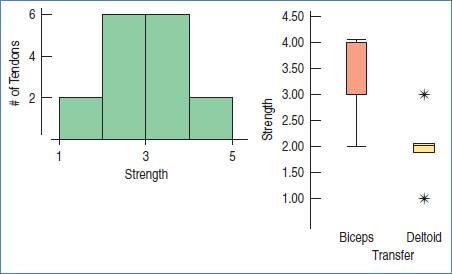
Symmetric.
Explanation of Solution
Given:

Calculation:
The shape of the distribution is symmetric.
b)
To find rang of the strength scores.
b)
Answer to Problem 10E
The
Explanation of Solution
Given:
Calculation:
We know, range is the difference between highest and lowest values.
c)
To explain the hidden facts.
c)
Answer to Problem 10E
We don’t know the number of results produced by each procedure done.
Explanation of Solution
Given:

Calculation:
From histogram, we don’t know the number of results produced by each procedure done. Therefore, it shows fairly low variations from the mean. This fact is hidden in Histogram.
d)
To explain which method had higher median score.
d)
Answer to Problem 10E
Biceps.
Explanation of Solution
Given:

Using boxplot, the higher median shows for the biceps transfer method as compare to Deltoid transfer method.
e)
To explain whether Biceps transfer method is always best.
e)
Answer to Problem 10E
No.
Explanation of Solution
Given:

The lower IQR and highest outliers of Deltoid can be best for sometimes. Hence, Deltoid is not always best method.
f)
To explain which method produces most consistent results.
f)
Answer to Problem 10E
Deltoid.
Explanation of Solution
Given:

The lower IQRof Deltoid deal as consistent results as compare to Biceps.
Chapter 5 Solutions
Stats: Modeling the World Nasta Edition Grades 9-12
Additional Math Textbook Solutions
STATS:DATA+MODELS-W/DVD
Introductory Statistics
Introductory Statistics (10th Edition)
Elementary Statistics Using Excel (6th Edition)
Essentials of Statistics, Books a la Carte Edition (5th Edition)


 MATLAB: An Introduction with ApplicationsStatisticsISBN:9781119256830Author:Amos GilatPublisher:John Wiley & Sons Inc
 Probability and Statistics for Engineering and th...StatisticsISBN:9781305251809Author:Jay L. DevorePublisher:Cengage Learning
 Statistics for The Behavioral Sciences (MindTap C...StatisticsISBN:9781305504912Author:Frederick J Gravetter, Larry B. WallnauPublisher:Cengage Learning
 Elementary Statistics: Picturing the World (7th E...StatisticsISBN:9780134683416Author:Ron Larson, Betsy FarberPublisher:PEARSON
 The Basic Practice of StatisticsStatisticsISBN:9781319042578Author:David S. Moore, William I. Notz, Michael A. FlignerPublisher:W. H. Freeman
 Introduction to the Practice of StatisticsStatisticsISBN:9781319013387Author:David S. Moore, George P. McCabe, Bruce A. CraigPublisher:W. H. Freeman