
Videos
a)
To explain approximately on what day the most flies die.
a)
Answer to Problem 35E
On 20th day.
Explanation of Solution
Given:


The graph of die shows the peak of the graph is at highest on about 20th day.
b)
To find the day during the first 100 days in which largest proportion of flies die.
b)
Answer to Problem 35E
On 60th day.
Explanation of Solution
Given:

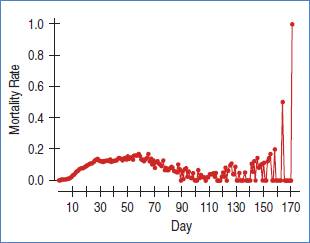
The graph of mortality rate shows that the highest between 0 and 100 days at about 60th day.
c)
To find when did the number of fruit flies alive stop changing very much from day to day.
c)
Answer to Problem 35E
After 40 days.
Explanation of Solution
Given:
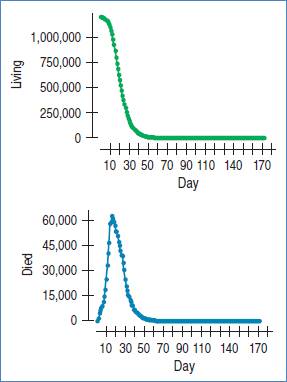

The graph of living shows almost constantly zero after about 40 days.
Chapter 5 Solutions
Stats: Modeling the World Nasta Edition Grades 9-12
Additional Math Textbook Solutions
Statistical Reasoning for Everyday Life (5th Edition)
Introductory Statistics
An Introduction to Mathematical Statistics and Its Applications (6th Edition)
Basic Business Statistics, Student Value Edition (13th Edition)


 MATLAB: An Introduction with ApplicationsStatisticsISBN:9781119256830Author:Amos GilatPublisher:John Wiley & Sons Inc
 Probability and Statistics for Engineering and th...StatisticsISBN:9781305251809Author:Jay L. DevorePublisher:Cengage Learning
 Statistics for The Behavioral Sciences (MindTap C...StatisticsISBN:9781305504912Author:Frederick J Gravetter, Larry B. WallnauPublisher:Cengage Learning
 Elementary Statistics: Picturing the World (7th E...StatisticsISBN:9780134683416Author:Ron Larson, Betsy FarberPublisher:PEARSON
 The Basic Practice of StatisticsStatisticsISBN:9781319042578Author:David S. Moore, William I. Notz, Michael A. FlignerPublisher:W. H. Freeman
 Introduction to the Practice of StatisticsStatisticsISBN:9781319013387Author:David S. Moore, George P. McCabe, Bruce A. CraigPublisher:W. H. Freeman