
Videos
a)
To find the median winning speed.
a)
Answer to Problem 27E
Median is 36.2.
Explanation of Solution
Given:

Calculation:
An estimated median is the intersection of the vertical line with horizontal axis with horizontal line at 50 on the vertical axis.
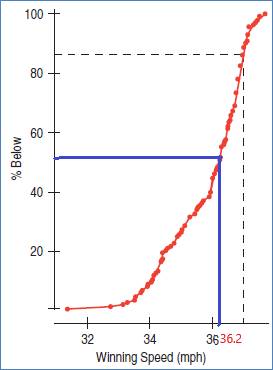
Hence, the median = 36.2.
b)
To find the
b)
Answer to Problem 27E
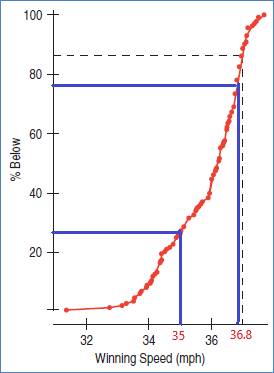
Quartile 1 is 35 and quartile 3 is 36.8.
Explanation of Solution
Given:

Calculation:
First we have to find Quartile 1. So, need to draw a horizontal line at 25 on the vertical axis. Then take intersection of the vertical line with horizontal axis.
An estimated
Follow the same procedure for quartile 3 just draw a horizontal line at 75 on the vertical axis.
An estimated
c)
To estimate
c)
Answer to Problem 27E
An estimated Range is 7 and IQR is 1.8
Explanation of Solution
Given:
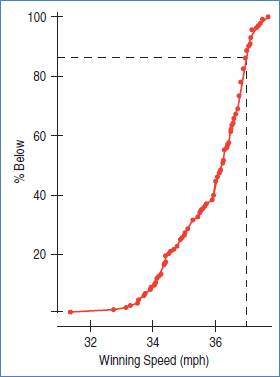
Quartile 1 is 35 and quartile 3 is 36.8.
Formula:
Calculation:
Using formula,
d)
To create a boxplot.
d)
Explanation of Solution
Given:

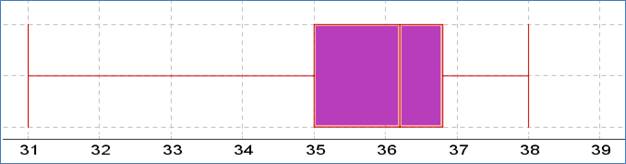
Quartile 1 is 35 and quartile 3 is 36.8.
Calculation:
The boxplot is,
e)
To explain the boxplot.
e)
Explanation of Solution
Given:


The shape of the distribution is left-skewed. The center is around 36.2. The spread of the distribution is between 31 and 38 mph. There are no outliers for the given data.
Chapter 5 Solutions
Stats: Modeling the World Nasta Edition Grades 9-12
Additional Math Textbook Solutions
Elementary Statistics
Basic Business Statistics, Student Value Edition
Intro Stats, Books a la Carte Edition (5th Edition)
Introductory Statistics (2nd Edition)


 MATLAB: An Introduction with ApplicationsStatisticsISBN:9781119256830Author:Amos GilatPublisher:John Wiley & Sons Inc
 Probability and Statistics for Engineering and th...StatisticsISBN:9781305251809Author:Jay L. DevorePublisher:Cengage Learning
 Statistics for The Behavioral Sciences (MindTap C...StatisticsISBN:9781305504912Author:Frederick J Gravetter, Larry B. WallnauPublisher:Cengage Learning
 Elementary Statistics: Picturing the World (7th E...StatisticsISBN:9780134683416Author:Ron Larson, Betsy FarberPublisher:PEARSON
 The Basic Practice of StatisticsStatisticsISBN:9781319042578Author:David S. Moore, William I. Notz, Michael A. FlignerPublisher:W. H. Freeman
 Introduction to the Practice of StatisticsStatisticsISBN:9781319013387Author:David S. Moore, George P. McCabe, Bruce A. CraigPublisher:W. H. Freeman