
Concept explainers
Videos
a)
To explain the shape of the distribution.
a)
Answer to Problem 23E
The shape of the distribution is skewed.
Explanation of Solution
Given:
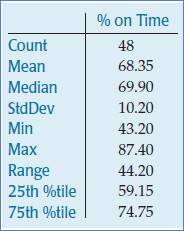
The shape of the distribution is skewed as median is closer to 75th percentile than 25th percentile.
b)
To explain whether there are outliers.
b)
Answer to Problem 23E
There are no any outliers.
Explanation of Solution
Given:

The outliers are those which lies above 1.5IQR of the 25th percentile and below 1.5 IQR of the 75th percentile. Therefore, given summary statistics is lies above 1.5IQR of the 25th percentile and below 1.5 IQR of the 75th percentile. Hence, there are no any outliers.
c)
To create a boxplot of the data.
c)
Explanation of Solution
Given:

Following is the boxplot:

d)
To write some sentences about the graduation rates.
d)
Explanation of Solution
Given:

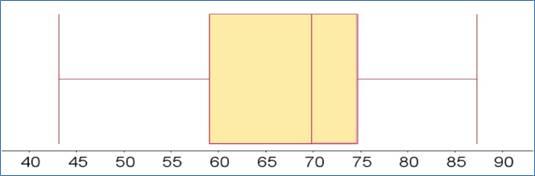
The graduation rate lies between 43% and 88%. From boxplot, the shape if the distribution seen right skewed. Also, the center of the distribution is about the 70%. The spread of the distribution is around the 15%.
Chapter 5 Solutions
Stats: Modeling the World Nasta Edition Grades 9-12
Additional Math Textbook Solutions
Elementary Statistics (13th Edition)
Basic Business Statistics, Student Value Edition
Statistical Reasoning for Everyday Life (5th Edition)
Essentials of Statistics, Books a la Carte Edition (5th Edition)


 MATLAB: An Introduction with ApplicationsStatisticsISBN:9781119256830Author:Amos GilatPublisher:John Wiley & Sons Inc
 Probability and Statistics for Engineering and th...StatisticsISBN:9781305251809Author:Jay L. DevorePublisher:Cengage Learning
 Statistics for The Behavioral Sciences (MindTap C...StatisticsISBN:9781305504912Author:Frederick J Gravetter, Larry B. WallnauPublisher:Cengage Learning
 Elementary Statistics: Picturing the World (7th E...StatisticsISBN:9780134683416Author:Ron Larson, Betsy FarberPublisher:PEARSON
 The Basic Practice of StatisticsStatisticsISBN:9781319042578Author:David S. Moore, William I. Notz, Michael A. FlignerPublisher:W. H. Freeman
 Introduction to the Practice of StatisticsStatisticsISBN:9781319013387Author:David S. Moore, George P. McCabe, Bruce A. CraigPublisher:W. H. Freeman