
Videos
a)
To find which statistics would be appropriate for center and spread of the distribution.
a)
Answer to Problem 12E
The median as a measure of center and IQR as a measure of spread should be appropriate.
Explanation of Solution
Given:

Calculation:
There are lot of outliers observed. Therefore, median as a measure of center and IQR as a measure of spread should be appropriate. Because both are does not influenced by an outlier.
b)
To find the number of parks which can be represent an outlier.
b)
Answer to Problem 12E
8 parks.
Explanation of Solution
Given:
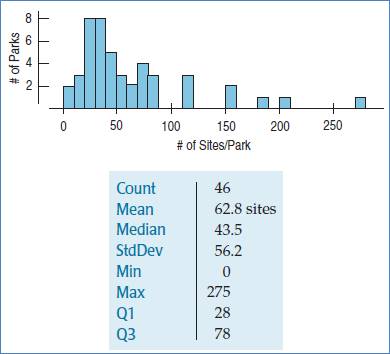
Calculation:
There are 5 bars that are separated from other bars and it creates 8 parks. Hence, 8 parks considered to be an outlier.
c)
To construct boxplot.
c)
Explanation of Solution
Given:

Calculation:
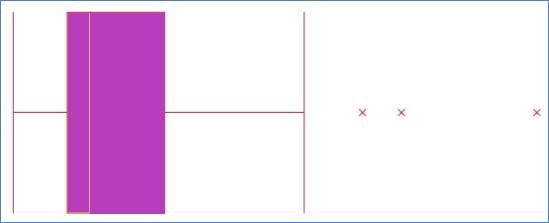
Following is the boxplot:
d)
To write a few sentences about the distribution.
d)
Explanation of Solution
Given:


Calculation:
As per boxplot, the shape of the distribution is left skewed. The center of the data is around 40 and spread is around 50. This distribution having 3 outliers which are around 185, 205 and 275.
Chapter 5 Solutions
Stats: Modeling the World Nasta Edition Grades 9-12
Additional Math Textbook Solutions
An Introduction to Mathematical Statistics and Its Applications (6th Edition)
STATS:DATA+MODELS-W/DVD
Statistics for Business and Economics (13th Edition)
Introductory Statistics (10th Edition)
Elementary Statistics
Essentials of Statistics (6th Edition)


 MATLAB: An Introduction with ApplicationsStatisticsISBN:9781119256830Author:Amos GilatPublisher:John Wiley & Sons Inc
 Probability and Statistics for Engineering and th...StatisticsISBN:9781305251809Author:Jay L. DevorePublisher:Cengage Learning
 Statistics for The Behavioral Sciences (MindTap C...StatisticsISBN:9781305504912Author:Frederick J Gravetter, Larry B. WallnauPublisher:Cengage Learning
 Elementary Statistics: Picturing the World (7th E...StatisticsISBN:9780134683416Author:Ron Larson, Betsy FarberPublisher:PEARSON
 The Basic Practice of StatisticsStatisticsISBN:9781319042578Author:David S. Moore, William I. Notz, Michael A. FlignerPublisher:W. H. Freeman
 Introduction to the Practice of StatisticsStatisticsISBN:9781319013387Author:David S. Moore, George P. McCabe, Bruce A. CraigPublisher:W. H. Freeman