
Concept explainers
Videos
a)
To explain why the acre-feet is a good way to measure the amount of precipitation produced by cloud seeding.
a)
Answer to Problem 40E
Because it describes the volume of the precipitation.
Explanation of Solution
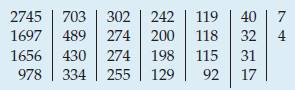
Given:

Calculation:
As it describes the volume of the precipitation. Hence, the acre-feet are a good way to measure the amount of precipitation produced by cloud seeding.
b)
To create a boxplot.
b)
Explanation of Solution
Given:

Calculation:
The boxplot is,
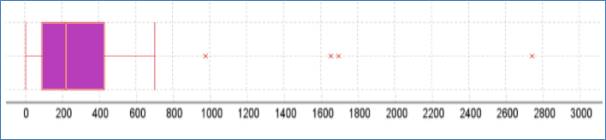
The shape of the distribution extremely right skewed. The center is around 200. The spread of the distribution is around between 0 and 700. It contains 4 outlier values.
c)
To create re-expression of this data.
c)
Explanation of Solution
Given:
Calculation:
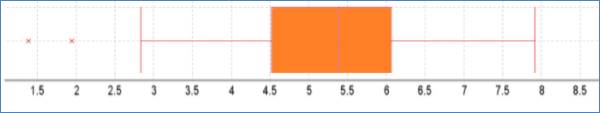
First step to take a natural logarithm of give data values:
| 7.9175 | 6.5554 | 5.7104 | 5.4889 | 4.7791 | 3.6889 | 1.9459 |
| 7.4366 | 6.1924 | 5.6131 | 5.2983 | 4.7707 | 3.4657 | 1.3863 |
| 7.4122 | 6.0638 | 5.6131 | 5.2883 | 4.7449 | 3.4340 | |
| 6.8855 | 5.8111 | 5.5413 | 4.8598 | 4.5218 | 2.8332 |
Therefore, boxplot of these data is,

d)
To explain re-expression scale means.
d)
Explanation of Solution
Given:

The purpose of re-expression is to make the distribution more symmetric and minimize the outliers. Therefore, it will easy to summarize and it will give more precise results.
Chapter 5 Solutions
Stats: Modeling the World Nasta Edition Grades 9-12
Additional Math Textbook Solutions
STATS:DATA+MODELS-W/DVD
Elementary Statistics (13th Edition)
Statistics for Psychology
Introductory Statistics (2nd Edition)
Statistics: The Art and Science of Learning from Data (4th Edition)
Essentials of Statistics, Books a la Carte Edition (5th Edition)


 MATLAB: An Introduction with ApplicationsStatisticsISBN:9781119256830Author:Amos GilatPublisher:John Wiley & Sons Inc
 Probability and Statistics for Engineering and th...StatisticsISBN:9781305251809Author:Jay L. DevorePublisher:Cengage Learning
 Statistics for The Behavioral Sciences (MindTap C...StatisticsISBN:9781305504912Author:Frederick J Gravetter, Larry B. WallnauPublisher:Cengage Learning
 Elementary Statistics: Picturing the World (7th E...StatisticsISBN:9780134683416Author:Ron Larson, Betsy FarberPublisher:PEARSON
 The Basic Practice of StatisticsStatisticsISBN:9781319042578Author:David S. Moore, William I. Notz, Michael A. FlignerPublisher:W. H. Freeman
 Introduction to the Practice of StatisticsStatisticsISBN:9781319013387Author:David S. Moore, George P. McCabe, Bruce A. CraigPublisher:W. H. Freeman