
Concept explainers
Videos
a)
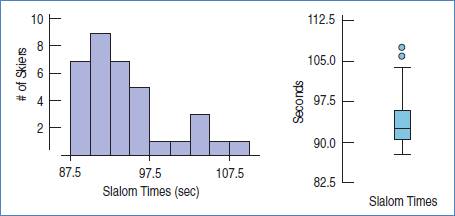
To explain features of the distribution from Histogram and boxplot.
a)
Answer to Problem 8E
The Histogram and boxplot shows the distribution is right skewed.
Explanation of Solution
Given:
Calculation:
The histogram shows the distribution is right skewed as highest bars at the left of the histogram. Also the box is to the bottom of the boxplot which suggest it is right skewed.
b)
To explain features of the distribution, include on Histogram but not in boxplot.
b)
Answer to Problem 8E
The gaps in the histogram represents regions with no values which are not visible in the boxplot.
Explanation of Solution
Given:

Calculation:
The gaps in the histogram represents regions with no values which are not visible in the boxplot.
c)
To explain which summary statistics is useful to summarize the center of the distribution.
c)
Answer to Problem 8E
Median.
Explanation of Solution
Given:

Calculation:
As the shape of the distribution is right skewed, I would prefer median as an appropriate summary statistic.
d)
To explain which summary statistics is useful to summarize the spread of the distribution.
d)
Answer to Problem 8E
IQR.
Explanation of Solution
Given:

Calculation:
As the shape of the distribution is right skewed, I would prefer IQR as an appropriate summary statistic.
Chapter 5 Solutions
Stats: Modeling the World Nasta Edition Grades 9-12
Additional Math Textbook Solutions
Basic Business Statistics, Student Value Edition (13th Edition)
Essentials of Statistics (6th Edition)
Statistical Reasoning for Everyday Life (5th Edition)
Introductory Statistics
Introductory Statistics (2nd Edition)


 MATLAB: An Introduction with ApplicationsStatisticsISBN:9781119256830Author:Amos GilatPublisher:John Wiley & Sons Inc
 Probability and Statistics for Engineering and th...StatisticsISBN:9781305251809Author:Jay L. DevorePublisher:Cengage Learning
 Statistics for The Behavioral Sciences (MindTap C...StatisticsISBN:9781305504912Author:Frederick J Gravetter, Larry B. WallnauPublisher:Cengage Learning
 Elementary Statistics: Picturing the World (7th E...StatisticsISBN:9780134683416Author:Ron Larson, Betsy FarberPublisher:PEARSON
 The Basic Practice of StatisticsStatisticsISBN:9781319042578Author:David S. Moore, William I. Notz, Michael A. FlignerPublisher:W. H. Freeman
 Introduction to the Practice of StatisticsStatisticsISBN:9781319013387Author:David S. Moore, George P. McCabe, Bruce A. CraigPublisher:W. H. Freeman