
Concept explainers
Videos
a)
To suggest change in histogram for better comparison.
a)
Answer to Problem 13E
The scale on the horizontal axis should be same.
Explanation of Solution
Given:

For better comparison, the scale on the horizontal axis should be same. So, we can make it 0 to 20 scale for both histograms.
b)
To explain the distributions.
b)
Answer to Problem 13E
The shape of the distribution of Men and Women are bot left skewed.
Explanation of Solution
Given:
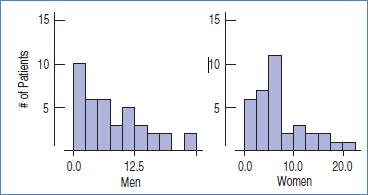
The shape of the distribution of Men and Women are bot left skewed. Also, the duration of Men has a larger spread as compare to Women. There seems to be an outlier in duration of Men however it is not in Women duration.
c)
To suggest a reason for the peak in Women’s length of stay.
c)
Answer to Problem 13E
Yes, because women have to stay longer for child births which is not true for men.
Explanation of Solution
Given:

In general, women have to stay longer for child births which is not true for men. This is the reason for the peak in Women’s length of stay.
Chapter 5 Solutions
Stats: Modeling the World Nasta Edition Grades 9-12
Additional Math Textbook Solutions
Statistics: The Art and Science of Learning from Data (4th Edition)
Essentials of Statistics (6th Edition)
Statistics for Business and Economics (13th Edition)
Elementary Statistics Using Excel (6th Edition)
Introductory Statistics
Elementary Statistics: Picturing the World (6th Edition)


 MATLAB: An Introduction with ApplicationsStatisticsISBN:9781119256830Author:Amos GilatPublisher:John Wiley & Sons Inc
 Probability and Statistics for Engineering and th...StatisticsISBN:9781305251809Author:Jay L. DevorePublisher:Cengage Learning
 Statistics for The Behavioral Sciences (MindTap C...StatisticsISBN:9781305504912Author:Frederick J Gravetter, Larry B. WallnauPublisher:Cengage Learning
 Elementary Statistics: Picturing the World (7th E...StatisticsISBN:9780134683416Author:Ron Larson, Betsy FarberPublisher:PEARSON
 The Basic Practice of StatisticsStatisticsISBN:9781319042578Author:David S. Moore, William I. Notz, Michael A. FlignerPublisher:W. H. Freeman
 Introduction to the Practice of StatisticsStatisticsISBN:9781319013387Author:David S. Moore, George P. McCabe, Bruce A. CraigPublisher:W. H. Freeman