
Videos
a)
To create an appropriate graphical display.
a)
Explanation of Solution
Given:
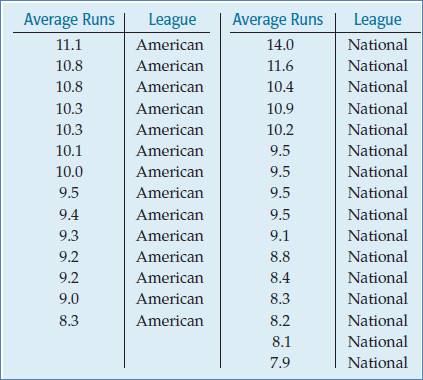
Calculation:
Let us assume that, Group 1: American and Group 2: National.
Therefore, the data summary and boxplot for the average runs:

b)
To create an appropriate graphical display.
b)
Explanation of Solution
Given:
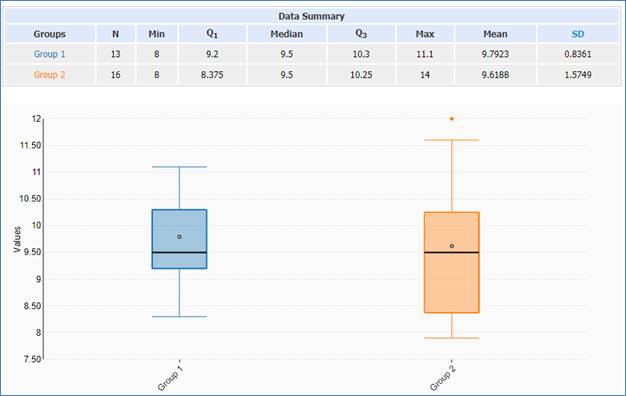
The shape of the distribution of the American League is skewed to the right. While the shape of the distribution of National league is skewed to the left. The center of both leagues is same. The spread of the distribution of National league is higher than American league. There are no such outliers for both leagues. The small higher point is shown for National league.
c)
To whether 14 is extremely large run.
c)
Explanation of Solution
Given:

Formula:
First, we need to find upper and lower outlier limits.
Therefore, 14 is above the upper outlier point. Hence, it is unusually high.
Chapter 5 Solutions
Stats: Modeling the World Nasta Edition Grades 9-12
Additional Math Textbook Solutions
Basic Business Statistics, Student Value Edition
Statistics for Psychology
STATS:DATA+MODELS-W/DVD
Statistics: The Art and Science of Learning from Data (4th Edition)
Essentials of Statistics, Books a la Carte Edition (5th Edition)
Intro Stats, Books a la Carte Edition (5th Edition)


 MATLAB: An Introduction with ApplicationsStatisticsISBN:9781119256830Author:Amos GilatPublisher:John Wiley & Sons Inc
 Probability and Statistics for Engineering and th...StatisticsISBN:9781305251809Author:Jay L. DevorePublisher:Cengage Learning
 Statistics for The Behavioral Sciences (MindTap C...StatisticsISBN:9781305504912Author:Frederick J Gravetter, Larry B. WallnauPublisher:Cengage Learning
 Elementary Statistics: Picturing the World (7th E...StatisticsISBN:9780134683416Author:Ron Larson, Betsy FarberPublisher:PEARSON
 The Basic Practice of StatisticsStatisticsISBN:9781319042578Author:David S. Moore, William I. Notz, Michael A. FlignerPublisher:W. H. Freeman
 Introduction to the Practice of StatisticsStatisticsISBN:9781319013387Author:David S. Moore, George P. McCabe, Bruce A. CraigPublisher:W. H. Freeman