
(a)
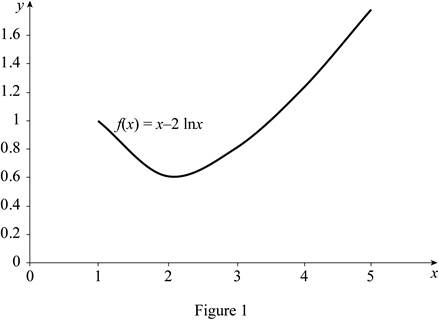
To draw:The graph for the function
(a)
Answer to Problem 6E
The graph for the function
Explanation of Solution
Given information:
The curve function is
The region lies in the interval
Draw the graph for the function
(b)
(i)
The area under the graph of f using right endpoints and four rectangles.
(b)
(i)
Answer to Problem 6E
The area under the graph of f using right endpoints and four rectangles is 4.44.
Explanation of Solution
Draw the graph for the function
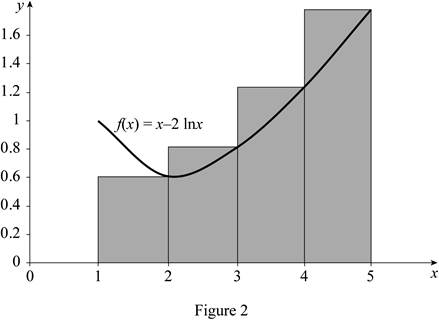
The expression to find the estimate of the areas of n rectangles
Here, the right endpoint height of the first rectangle is
Find the width
Here, the upper limit is b, the lower limit is a, and the number of rectangles is n.
Find the area estimate for four rectangles with right end points:
Substitute 5 for b, 1 for a, and 4 for n in Equation (2).
Refer to Figure 2.
Take the right endpoint height of the first rectangle’s
Substitute 4 for n, 0.6 for
Therefore, the area under the graph of f using right endpoints for
(ii)
The area under the graph of f using midpoints and four rectangles.
(ii)
Answer to Problem 6E
The area under the graph of f using midpoints and four rectangles is 3.93.
Explanation of Solution
Draw the graph for the function
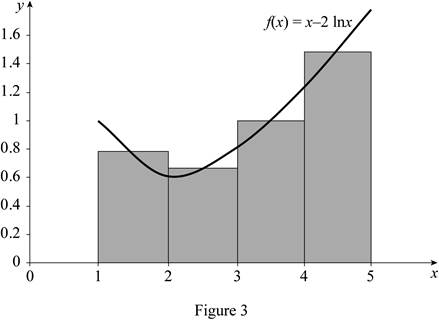
The expression to find the estimate of the areas of n rectangles
Here, the midpoint height of the first rectangle is
Find the area estimate for four rectangles with mid points:
Refer to Figure 3.
Take the midpoint height of the first rectangle’s
Substitute 4 for n, 0.78 for
Therefore, the area under the graph of f using mid points for
(c)
(i)
The area under the graph of f using right endpoints and eight rectangles.
(c)
(i)
Answer to Problem 6E
The area under the graph of f using right endpoints and eight rectangles is 3.94.
Explanation of Solution
Draw the graph for the function
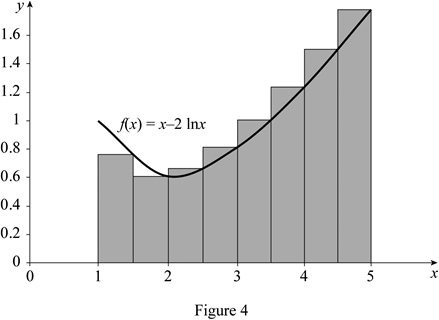
Find the area estimate for eight rectangles with right end points:
Substitute 5 for b, 1 for a, and 8 for n in Equation (2).
Refer to Figure 4.
Take the right endpoint height of the first rectangle’s
Substitute 8 for n, 0.76 for
Therefore, the area under the graph of f using right endpoints for
(ii)
The area under the graph of f using midpoints and eight rectangles.
(ii)
Answer to Problem 6E
The area under the graph of f using midpoints and eight rectangles is 3.975.
Explanation of Solution
Draw the graph for the function
Find the area estimate for eight rectangles with mid points:
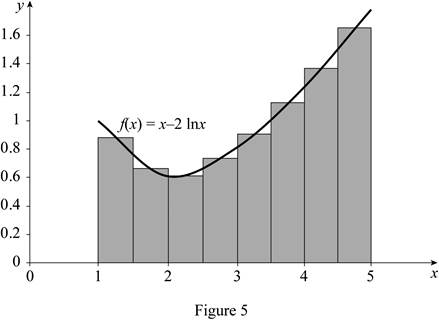
Refer to Figure 5.
Take the midpoint height of the first rectangle’s
Substitute 8 for n, 0.87 for
Therefore, the area under the graph of f using mid points for
Chapter 5 Solutions
Single Variable Calculus: Concepts and Contexts, Enhanced Edition

 Calculus: Early TranscendentalsCalculusISBN:9781285741550Author:James StewartPublisher:Cengage Learning
 Thomas' Calculus (14th Edition)CalculusISBN:9780134438986Author:Joel R. Hass, Christopher E. Heil, Maurice D. WeirPublisher:PEARSON
 Calculus: Early Transcendentals (3rd Edition)CalculusISBN:9780134763644Author:William L. Briggs, Lyle Cochran, Bernard Gillett, Eric SchulzPublisher:PEARSON
 Calculus: Early TranscendentalsCalculusISBN:9781319050740Author:Jon Rogawski, Colin Adams, Robert FranzosaPublisher:W. H. Freeman
 Calculus: Early Transcendental FunctionsCalculusISBN:9781337552516Author:Ron Larson, Bruce H. EdwardsPublisher:Cengage Learning