
Videos
Previous studies have shown that supplementing the diet with oat bran may lower serum-cholesterol levels. However, it is not known whether the cholesterol is reduced by a direct effect of oat bran or by replacing fatty foods in the diet. To address this question, a study was performed to compare the effect of dietary supplementation with high-fiber oat bran (87 g/day) to dietary supplementation with a low-fiber refined wheat product on the serum cholesterol of 20 healthy participants ages 23-49 years [3]. Each subject had a cholesterol level measured at baseline and then was randomly assigned to receive either a high-fiber or a low-fiber diet for 6 weeks. A 2-week period followed during which no supplements were taken. Participants then took the alternate supplement for a 6-week period. The results are shown in Table 7.7.
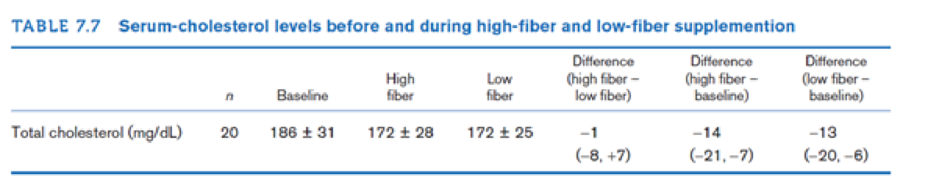
Note: Plus-minus (±)
How many participants would be needed to have a 90% chance of finding a significant difference in mean cholesterol lowering between the high- and low-fiber diets if the high-fiber diet lowers mean cholesterol by 5 mg/dL more than the low-fiber diet and a two-sided test is used with significance level = .05?
Want to see the full answer?
Check out a sample textbook solution
Chapter 7 Solutions
Fundamentals of Biostatistics


- At the 5% level of significance, which variables are statistically significant? If the price of cement per yard increases by 10, what will happen to the estimated quantity of cement demanded? What happens if it will increase by 20%?arrow_forwardA headline on a news website stated “Sheep with a varied diet grew faster and produced less pollutants, new study finds.” The article reports that scientists using pregnant sheep that were twin-bearing to test how diet affected the lambs. When the twin lambs were born, one lamb was put on a typical rye grass diet, while the other was given a variety of feeds, including chicory, plantain, red clover and lucerne. The impact was huge, with the lambs given a variety of feeds seeing a 100 per cent increase in growth, excreted less nitrogen into the environment and had an improved well-being.Describe in one or two sentences what is the explanatory variable and what are the response variables mentioned in this study.arrow_forwardA headline on a news website stated “Sheep with a varied diet grew faster and produced less pollutants, new study finds.” The article reports that scientists using pregnant sheep that were twin-bearing to test how diet affected the lambs. When the twin lambs were born, one lamb was put on a typical rye grass diet, while the other was given a variety of feeds, including chicory, plantain, red clover and lucerne. The impact was huge, with the lambs given a variety of feeds seeing a 100 per cent increase in growth, excreted less nitrogen into the environment and had an improved well-being. The headline of the article mentioned above implies causation. Explain in one or two sentences if implying causation is appropriate based on the study describedarrow_forward
- In an experimental study, it was noticed that people who eat more leafy, green vegetables tend to get better sleep than the general population. Researchers wonder whether the improved sleep might be caused by the minerals potassium and magnesium found in leafy, green vegetables. How could the researchers design an experiment to determine the effects of potassium and magnesium on sleep?arrow_forwardA group of 10-year-old boys were first ascertained in a camp for diabetic boys. They had their weight measured at baseline and again when they returned to camp 1 year later. Each time, a serum sample was obtained from which a determination of hemoglobin A1c (HgbA1c) was made. HgbA1c (also called glycosylated hemoglobin) is routinely used to monitor compliance with taking insulin injections. Usually, the poorer the compliance, the higher the HgbA1c level will be. The hypothesis is that the level HgbA1c is related to weight. The data in Table 11.28 were obtained. 11.92 What test can be performed to assess the relationship between weight and HgbA1c at the initial visit? 11.93 Please perform the test in Problem 11.92, and report a two-tailed p-value. 11.94 Do the results in Problem 11.93 imply a relationship between change in HgbA1c and change in weight for an individual boy? Why or why not?arrow_forwardA group of 10-year-old boys were first ascertained in a camp for diabetic boys. They had their weight measured at baseline and again when they returned to camp 1 year later. Each time, a serum sample was obtained from which a determination of hemoglobin A1c (HgbA1c) was made. HgbA1c (also called glycosylated hemoglobin) is routinely used to monitor compliance with taking insulin injections. Usually, the poorer the compliance, the higher the HgbA1c level will be. The hypothesis is that the level HgbA1c is related to weight. The data in Table 11.28 were obtained.11.92 What test can be performed to assess the relationship between weight and HgbA1c at the initial visit?11.93 Please perform the test in Problem 11.92, and report a two-tailed p-value.11.94 Do the results in Problem 11.93 imply a relationship between change in HgbA1c and change in weight for an individual boy? Why or why not?11.95 Compute a rank correlation between change in weight and change in HgbA1c, each over 1 year. Use…arrow_forward
- A group of 10-year-old boys were first ascertained in a camp for diabetic boys. They had their weight measured at baseline and again when they returned to camp 1 year later. Each time, a serum sample was obtained from which a determination of hemoglobin A1c (HgbA1c) was made. HgbA1c (also called glycosylated hemoglobin) is routinely used to monitor compliance with taking insulin injections. Usually, the poorer the compliance, the higher the HgbA1c level will be. The hypothesis is that the level HgbA1c is related to weight. The data in Table 11.28 were obtained.11.94 Do the results in Problem 11.93 imply a relationship between change in HgbA1c and change in weight for an individual boy? Why or why not?11.95 Compute a rank correlation between change in weight and change in HgbA1c, each over 1 year. Use this measure to directly test the hypothesis that change in weight over 1 year is related to change in HgbA1c. Report a two-tailed p-value, and provide a 95% confidence interval for the…arrow_forwardIt is hypothesized that there are fluctuations in norepinephrine (NE) levels which accompany fluctuations in affect with bipolar affective disorder (manic-depressive illness). Thus, during depressive states, NE levels drop; during manic states, NE levels increase. To test this relationship, researchers measured the level of NE by measuring the metabolite 3-methoxy-4-hydroxyphenylglycol (MHPG in micro gram per 24 hour) in the patient's urine experiencing varying levels of mania/depression. Increased levels of MHPG are correlated with increased metabolism (thus higher levels) of central nervous system NE. Levels of mania/depression were also recorded on a scale with a low score indicating increased mania and a high score increased depression. The data is provided below. MHPG Affect 980 22 1209 26 1403 8 1950 10 1814 5 1280 19 1073 26 1066 12 880 23 776 28 a. Can MHPG significantly predict…arrow_forwardBased on the results presented, did the exercise intervention groups still receive a health benefit even if significant weight loss did not occur? Explain.arrow_forward
- A biochemist is testing the effect of a new antibiotic on a particulararrow_forwardA study was conducted to assess the impact of nutrient enrichment on zooplankton densities in A & B Islands. An ecologist sampled populations of zooplankton in these two locations and observed the nutrient enrichment level was higher in A island when compared with the level in B island. It is predicted the zooplankton densities in A island will be greater than those found in B island.arrow_forwardResearchers interested in lead exposure due to car exhaust sampled the blood of 52 police officers subjected to constant inhalation of automobile exhaust fumes while working traffic enforcement in a primarily urban environment. The blood samples of these officers had an average lead concentration of 124.32 µg/l and a SD of 37.74 µg/l; a previous study of individuals from a nearby suburb, with no history of exposure, found an average blood level concentration of 35 µg/l. Test the hypothesis that the downtown police officers have a higher lead exposure than the group in the previous study. Interpret your results in context. Based on your preceding result, without performing a calculation, would a 99% confidence interval for the average blood concentration level of police officers contain 35 µg/l? Based on your preceding result, without performing a calculation, would a 99% confidence interval for this difference contain 0? Explain why or why not.arrow_forward
 MATLAB: An Introduction with ApplicationsStatisticsISBN:9781119256830Author:Amos GilatPublisher:John Wiley & Sons Inc
 Probability and Statistics for Engineering and th...StatisticsISBN:9781305251809Author:Jay L. DevorePublisher:Cengage Learning
 Statistics for The Behavioral Sciences (MindTap C...StatisticsISBN:9781305504912Author:Frederick J Gravetter, Larry B. WallnauPublisher:Cengage Learning
 Elementary Statistics: Picturing the World (7th E...StatisticsISBN:9780134683416Author:Ron Larson, Betsy FarberPublisher:PEARSON
 The Basic Practice of StatisticsStatisticsISBN:9781319042578Author:David S. Moore, William I. Notz, Michael A. FlignerPublisher:W. H. Freeman
 Introduction to the Practice of StatisticsStatisticsISBN:9781319013387Author:David S. Moore, George P. McCabe, Bruce A. CraigPublisher:W. H. Freeman