
Videos
(a)
To explain: the misleading impression given by the graph
(a)
Answer to Problem 3CRE
The misleading impression given by the graph is the width of all cell phones, text message of smartphone and the proportion of the cell-phones.
Explanation of Solution
Given:
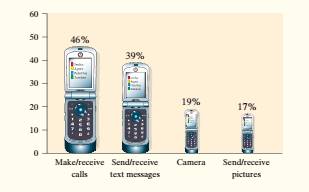
The provided graph gives the misleading impression as the sum of the percentage is:
It is required that data must have percentage exactly equal to 100% otherwise the data will be misleading and will give inappropriate conclusion to the readers.
The smartphone of text message is about 4 times as large as the smartphone of camera and thus the differences between the two categories were exaggerated.
The width of all cell phones should be the same, while the height indicated the percent.
(b)
To find: whether the given data is used to make a pie chart
(b)
Answer to Problem 3CRE
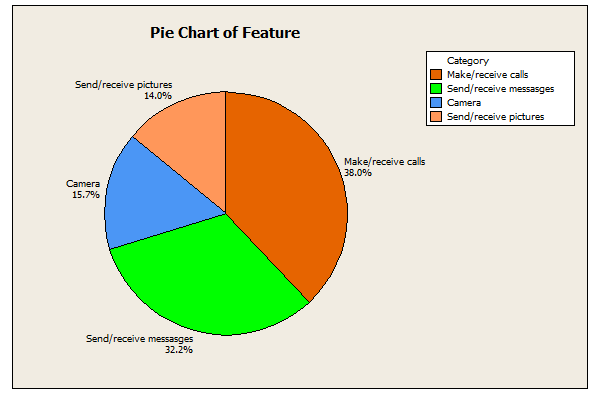
The pie charts are the best graph to represent the data with percentages
Explanation of Solution
As it is known that the pie charts are the best graph to represent the data with percentages because it represents the shaded region for each category with their respective percentages.
(c)
To make: a graph of the data
(c)
Answer to Problem 3CRE
Conclusion:
Explanation of Solution
Given:
Data on the percent who indicated a particular feature is vital.
Calculation:
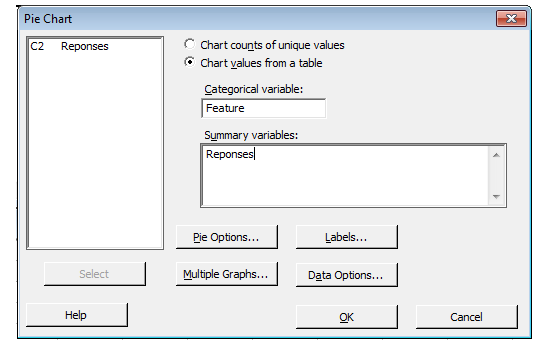
As it is known that the pie charts are the best graph to represent the data with percentages. So, make the pie chart by using MINITAB as below:
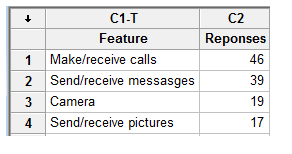
Firstly write down the whole data into MINITAB. The screenshot is given as below.
Now, click on Graph menu and then select the pie chart option from the dropdown. After this anew dialog box will open. In this, firstly select the option of chart values from a table, then select the feature in categorical variables and select the responses in summary of variable. The screenshot is given as below:
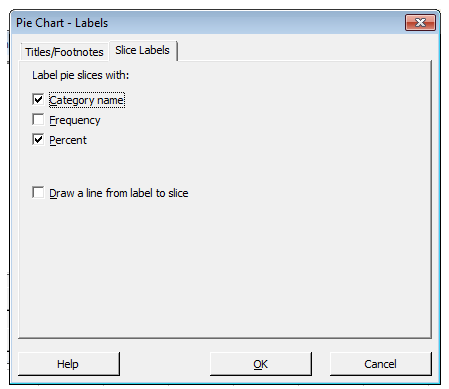
After this, click on Labels option. Then a new dialog box will open. In this, click on slice labels tab and then choose the category name and percentage option. The screenshot is given as below
Now, finally click on OK button to return to the older dialog box and then click on OK button of it too to have the required pie chart. The graph is given as below.

Conclusion:
Therefore, the graph is drawn.
Conclusion:
Chapter 1 Solutions
The Practice of Statistics for AP - 4th Edition
Additional Math Textbook Solutions
Elementary Statistics Using Excel (6th Edition)
Statistics for Psychology
Introductory Statistics
Basic Business Statistics, Student Value Edition
Statistical Reasoning for Everyday Life (5th Edition)


 MATLAB: An Introduction with ApplicationsStatisticsISBN:9781119256830Author:Amos GilatPublisher:John Wiley & Sons Inc
 Probability and Statistics for Engineering and th...StatisticsISBN:9781305251809Author:Jay L. DevorePublisher:Cengage Learning
 Statistics for The Behavioral Sciences (MindTap C...StatisticsISBN:9781305504912Author:Frederick J Gravetter, Larry B. WallnauPublisher:Cengage Learning
 Elementary Statistics: Picturing the World (7th E...StatisticsISBN:9780134683416Author:Ron Larson, Betsy FarberPublisher:PEARSON
 The Basic Practice of StatisticsStatisticsISBN:9781319042578Author:David S. Moore, William I. Notz, Michael A. FlignerPublisher:W. H. Freeman
 Introduction to the Practice of StatisticsStatisticsISBN:9781319013387Author:David S. Moore, George P. McCabe, Bruce A. CraigPublisher:W. H. Freeman