The Practice of Statistics for AP - 4th Edition
4th Edition
ISBN: 9781429245593
Author: Starnes, Daren S., Yates, Daniel S., Moore, David S.
Publisher: Macmillan Higher Education
bartleby

Concept explainers

bartleby

Videos

Question
Book Icon
Chapter 1.3, Problem 94E

(a)

To determine

To make: a boxplot of the given data

(a)

Expert Solution
Check Mark

Answer to Problem 94E

  The Practice of Statistics for AP - 4th Edition, Chapter 1.3, Problem 94E , additional homework tip  1

Explanation of Solution

Given:

  The Practice of Statistics for AP - 4th Edition, Chapter 1.3, Problem 94E , additional homework tip  2

Calculation:

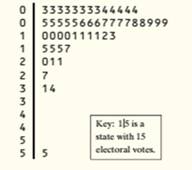
Sort the data values:

3, 3, 3, 3, 3, 3, 3, 3, 4, 4, 4, 4, 4, 5, 5, 5, 5, 5, 6, 6, 6, 7, 7, 7, 7, 8, 8, 9, 9, 9,10,10, 10, 10, 11, 11, 11, 11, 12, 13, 15, 15, 15, 17,20,21,21,27,31, 34,55

Since the number of data values is odd, the median is the middle value of the sorted data set:

MEDIAN = 8

The first quartile is the median of all data values below the median. Since the data set contains 25 values below the median, the first quartile is then the 13th data value.

  Q1=4

The third quartile is the median of all data values above the median. Since the data set contains 12 values above the median, the third quartile is then the 39th data value.

  Q3=12

Outliers are observations that are more than 1.5 times the IQR above Q3 or below Ql. The interquartile range is the difference between the third and first quartile.

  Q3+1.5IQR=12+1.5(124)=24Q1+1.5IQR=41.5(124)=9

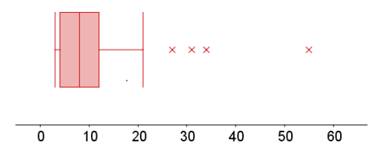
The minimum is 3 and the maximum is 55. We then note that 27, 31, 34 and 55 are outliers.

Create a boxplot

The outliers are represented by an X. The box has boundaries the quartiles and a line has been drawn at the median. The whiskers represent the minimum and maximum of the data points (that are not outliers).

  The Practice of Statistics for AP - 4th Edition, Chapter 1.3, Problem 94E , additional homework tip  3

Conclusion:

Therefore, a boxplot of the given data is drawn.

(b)

To determine

To find: to summarize the distribution which one is used

(b)

Expert Solution
Check Mark

Answer to Problem 94E

It is best to summarize the distribution by using the median and the IQR

Explanation of Solution

In exercise 94a, we found that the data contains 4 outliers.

It is best to summarize the distribution by using the median and the IQR, because they are not influenced by theoutliers, while the mean and the standard deviation are influenced by the outliers.

Chapter 1 Solutions

The Practice of Statistics for AP - 4th Edition

Ch. 1.1 - Prob. 16ECh. 1.1 - Prob. 17ECh. 1.1 - Prob. 18ECh. 1.1 - Prob. 19ECh. 1.1 - Prob. 20ECh. 1.1 - Prob. 21ECh. 1.1 - Prob. 22ECh. 1.1 - Prob. 23ECh. 1.1 - Prob. 24ECh. 1.1 - Prob. 25ECh. 1.1 - Prob. 26ECh. 1.1 - Prob. 27ECh. 1.1 - Prob. 28ECh. 1.1 - Prob. 29ECh. 1.1 - Prob. 30ECh. 1.1 - Prob. 31ECh. 1.1 - Prob. 32ECh. 1.1 - Prob. 33ECh. 1.1 - Prob. 34ECh. 1.1 - Prob. 35ECh. 1.1 - Prob. 36ECh. 1.2 - Prob. 1.1CYUCh. 1.2 - Prob. 1.2CYUCh. 1.2 - Prob. 1.3CYUCh. 1.2 - Prob. 1.4CYUCh. 1.2 - Prob. 2.1CYUCh. 1.2 - Prob. 2.2CYUCh. 1.2 - Prob. 2.3CYUCh. 1.2 - Prob. 2.4CYUCh. 1.2 - Prob. 3.1CYUCh. 1.2 - Prob. 3.2CYUCh. 1.2 - Prob. 4.1CYUCh. 1.2 - Prob. 4.2CYUCh. 1.2 - Prob. 4.3CYUCh. 1.2 - Prob. 4.4CYUCh. 1.2 - Prob. 37ECh. 1.2 - Prob. 38ECh. 1.2 - Prob. 39ECh. 1.2 - Prob. 40ECh. 1.2 - Prob. 41ECh. 1.2 - Prob. 42ECh. 1.2 - Prob. 43ECh. 1.2 - Prob. 44ECh. 1.2 - Prob. 45ECh. 1.2 - Prob. 46ECh. 1.2 - Prob. 47ECh. 1.2 - Prob. 48ECh. 1.2 - Prob. 49ECh. 1.2 - Prob. 50ECh. 1.2 - Prob. 51ECh. 1.2 - Prob. 52ECh. 1.2 - Prob. 53ECh. 1.2 - Prob. 54ECh. 1.2 - Prob. 55ECh. 1.2 - Prob. 56ECh. 1.2 - Prob. 57ECh. 1.2 - Prob. 58ECh. 1.2 - Prob. 59ECh. 1.2 - Prob. 60ECh. 1.2 - Prob. 61ECh. 1.2 - Prob. 62ECh. 1.2 - Prob. 63ECh. 1.2 - Prob. 64ECh. 1.2 - Prob. 65ECh. 1.2 - Prob. 66ECh. 1.2 - Prob. 67ECh. 1.2 - Prob. 68ECh. 1.2 - Prob. 69ECh. 1.2 - Prob. 70ECh. 1.2 - Prob. 71ECh. 1.2 - Prob. 72ECh. 1.2 - Prob. 73ECh. 1.2 - Prob. 74ECh. 1.2 - Prob. 75ECh. 1.2 - Prob. 76ECh. 1.2 - Prob. 77ECh. 1.2 - Prob. 78ECh. 1.3 - Prob. 1.1CYUCh. 1.3 - Prob. 1.2CYUCh. 1.3 - Prob. 1.3CYUCh. 1.3 - Prob. 1.4CYUCh. 1.3 - Prob. 2.1CYUCh. 1.3 - Prob. 2.2CYUCh. 1.3 - Prob. 2.3CYUCh. 1.3 - Prob. 2.4CYUCh. 1.3 - Prob. 3.1CYUCh. 1.3 - Prob. 3.2CYUCh. 1.3 - Prob. 3.3CYUCh. 1.3 - Prob. 3.4CYUCh. 1.3 - Prob. 79ECh. 1.3 - Prob. 80ECh. 1.3 - Prob. 81ECh. 1.3 - Prob. 82ECh. 1.3 - Prob. 83ECh. 1.3 - Prob. 84ECh. 1.3 - Prob. 85ECh. 1.3 - Prob. 86ECh. 1.3 - Prob. 87ECh. 1.3 - Prob. 88ECh. 1.3 - Prob. 89ECh. 1.3 - Prob. 90ECh. 1.3 - Prob. 91ECh. 1.3 - Prob. 92ECh. 1.3 - Prob. 93ECh. 1.3 - Prob. 94ECh. 1.3 - Prob. 95ECh. 1.3 - Prob. 96ECh. 1.3 - Prob. 97ECh. 1.3 - Prob. 98ECh. 1.3 - Prob. 99ECh. 1.3 - Prob. 100ECh. 1.3 - Prob. 101ECh. 1.3 - Prob. 102ECh. 1.3 - Prob. 103ECh. 1.3 - Prob. 104ECh. 1.3 - Prob. 105ECh. 1.3 - Prob. 106ECh. 1.3 - Prob. 107ECh. 1.3 - Prob. 108ECh. 1.3 - Prob. 109ECh. 1.3 - Prob. 110ECh. 1.3 - Prob. 111ECh. 1.3 - Prob. 112ECh. 1.3 - Prob. 113ECh. 1 - Prob. 1CYUCh. 1 - Prob. 2CYUCh. 1 - Prob. 1ECh. 1 - Prob. 2ECh. 1 - Prob. 3ECh. 1 - Prob. 4ECh. 1 - Prob. 5ECh. 1 - Prob. 6ECh. 1 - Prob. 7ECh. 1 - Prob. 8ECh. 1 - Prob. 1CRECh. 1 - Prob. 2CRECh. 1 - Prob. 3CRECh. 1 - Prob. 4CRECh. 1 - Prob. 5CRECh. 1 - Prob. 6CRECh. 1 - Prob. 7CRECh. 1 - Prob. 8CRECh. 1 - Prob. 9CRECh. 1 - Prob. 10CRECh. 1 - Prob. 1PTCh. 1 - Prob. 2PTCh. 1 - Prob. 3PTCh. 1 - Prob. 4PTCh. 1 - Prob. 5PTCh. 1 - Prob. 6PTCh. 1 - Prob. 7PTCh. 1 - Prob. 8PTCh. 1 - Prob. 9PTCh. 1 - Prob. 10PTCh. 1 - Prob. 11PTCh. 1 - Prob. 12PTCh. 1 - Prob. 13PTCh. 1 - Prob. 14PTCh. 1 - Prob. 15PT
Knowledge Booster
Background pattern image
Statistics
Learn more about
Need a deep-dive on the concept behind this application? Look no further. Learn more about this topic, statistics and related others by exploring similar questions and additional content below.
Recommended textbooks for you
Text book image
MATLAB: An Introduction with Applications
Statistics
ISBN:9781119256830
Author:Amos Gilat
Publisher:John Wiley & Sons Inc
Text book image
Probability and Statistics for Engineering and th...
Statistics
ISBN:9781305251809
Author:Jay L. Devore
Publisher:Cengage Learning
Text book image
Statistics for The Behavioral Sciences (MindTap C...
Statistics
ISBN:9781305504912
Author:Frederick J Gravetter, Larry B. Wallnau
Publisher:Cengage Learning
Text book image
Elementary Statistics: Picturing the World (7th E...
Statistics
ISBN:9780134683416
Author:Ron Larson, Betsy Farber
Publisher:PEARSON
Text book image
The Basic Practice of Statistics
Statistics
ISBN:9781319042578
Author:David S. Moore, William I. Notz, Michael A. Fligner
Publisher:W. H. Freeman
Text book image
Introduction to the Practice of Statistics
Statistics
ISBN:9781319013387
Author:David S. Moore, George P. McCabe, Bruce A. Craig
Publisher:W. H. Freeman
The Shape of Data: Distributions: Crash Course Statistics #7; Author: CrashCourse;https://www.youtube.com/watch?v=bPFNxD3Yg6U;License: Standard YouTube License, CC-BY
Shape, Center, and Spread - Module 20.2 (Part 1); Author: Mrmathblog;https://www.youtube.com/watch?v=COaid7O_Gag;License: Standard YouTube License, CC-BY
Shape, Center and Spread; Author: Emily Murdock;https://www.youtube.com/watch?v=_YyW0DSCzpM;License: Standard Youtube License