The Practice of Statistics for AP - 4th Edition
4th Edition
ISBN: 9781429245593
Author: Starnes, Daren S., Yates, Daniel S., Moore, David S.
Publisher: Macmillan Higher Education
bartleby

Concept explainers

bartleby

Videos

Question
Book Icon
Chapter 1.2, Problem 37E

(a)

To determine

To make: A dotplot to display the given data.

(a)

Expert Solution
Check Mark

Answer to Problem 37E

  The Practice of Statistics for AP - 4th Edition, Chapter 1.2, Problem 37E , additional homework tip  1

Explanation of Solution

Given:

    96868866.5679434
    5611636610784.5977

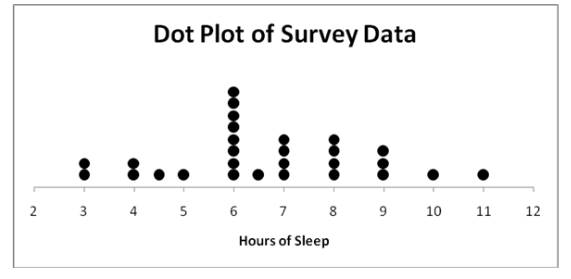
We have a data on the sleeping hours of the students.

Dot plot is one of the simplest graph that shows each data value as a dot above its location on number line. The dot plot of the given data is as follows:

  The Practice of Statistics for AP - 4th Edition, Chapter 1.2, Problem 37E , additional homework tip  2

Conclusion:

Thus, a dotplot is drawn.

(b)

To determine

To describe: The overall pattern of the distribution and deviations from that pattern.

(b)

Expert Solution
Check Mark

Answer to Problem 37E

Shape: the data is roughly symmetric.

Centre: about 6 hours, because the highest dots are at 6 in the dotplot.

Spread: it is between 3 hours and 11 hours.

Outliers: there do not appear to be deviations from the pattern.

Explanation of Solution

The overall pattern of the distribution can be described by its shape, center, spread and outliers.

Shape: the Dot plot has the peak at 6 this means that maximum students have slept for 6 hour’s night before the survey was done. Thus 6 is the mode. Most of the students have slept between 6 to 9 hours. However, distribution has a long tall towards right.

Centre: We can describe centre by finding a value that devides the observations. So that about half take larger values and about half take smaller values. This is called Median of the distribution which is 6 for this data. We can also calculate the mean no of hours that is 6.64 for this data.

Spread: The spread of given data is from 3 hours to 11 hours. The range can be calculated by subtracting smallest value from largest value 11hrs3hrs=8hrs .

Outliers: The values that differ somewhat from the overall pattern. However they do stand clearly apart from the rest of the distribution. We do not have an outlier in the given distribution.

Chapter 1 Solutions

The Practice of Statistics for AP - 4th Edition

Ch. 1.1 - Prob. 16ECh. 1.1 - Prob. 17ECh. 1.1 - Prob. 18ECh. 1.1 - Prob. 19ECh. 1.1 - Prob. 20ECh. 1.1 - Prob. 21ECh. 1.1 - Prob. 22ECh. 1.1 - Prob. 23ECh. 1.1 - Prob. 24ECh. 1.1 - Prob. 25ECh. 1.1 - Prob. 26ECh. 1.1 - Prob. 27ECh. 1.1 - Prob. 28ECh. 1.1 - Prob. 29ECh. 1.1 - Prob. 30ECh. 1.1 - Prob. 31ECh. 1.1 - Prob. 32ECh. 1.1 - Prob. 33ECh. 1.1 - Prob. 34ECh. 1.1 - Prob. 35ECh. 1.1 - Prob. 36ECh. 1.2 - Prob. 1.1CYUCh. 1.2 - Prob. 1.2CYUCh. 1.2 - Prob. 1.3CYUCh. 1.2 - Prob. 1.4CYUCh. 1.2 - Prob. 2.1CYUCh. 1.2 - Prob. 2.2CYUCh. 1.2 - Prob. 2.3CYUCh. 1.2 - Prob. 2.4CYUCh. 1.2 - Prob. 3.1CYUCh. 1.2 - Prob. 3.2CYUCh. 1.2 - Prob. 4.1CYUCh. 1.2 - Prob. 4.2CYUCh. 1.2 - Prob. 4.3CYUCh. 1.2 - Prob. 4.4CYUCh. 1.2 - Prob. 37ECh. 1.2 - Prob. 38ECh. 1.2 - Prob. 39ECh. 1.2 - Prob. 40ECh. 1.2 - Prob. 41ECh. 1.2 - Prob. 42ECh. 1.2 - Prob. 43ECh. 1.2 - Prob. 44ECh. 1.2 - Prob. 45ECh. 1.2 - Prob. 46ECh. 1.2 - Prob. 47ECh. 1.2 - Prob. 48ECh. 1.2 - Prob. 49ECh. 1.2 - Prob. 50ECh. 1.2 - Prob. 51ECh. 1.2 - Prob. 52ECh. 1.2 - Prob. 53ECh. 1.2 - Prob. 54ECh. 1.2 - Prob. 55ECh. 1.2 - Prob. 56ECh. 1.2 - Prob. 57ECh. 1.2 - Prob. 58ECh. 1.2 - Prob. 59ECh. 1.2 - Prob. 60ECh. 1.2 - Prob. 61ECh. 1.2 - Prob. 62ECh. 1.2 - Prob. 63ECh. 1.2 - Prob. 64ECh. 1.2 - Prob. 65ECh. 1.2 - Prob. 66ECh. 1.2 - Prob. 67ECh. 1.2 - Prob. 68ECh. 1.2 - Prob. 69ECh. 1.2 - Prob. 70ECh. 1.2 - Prob. 71ECh. 1.2 - Prob. 72ECh. 1.2 - Prob. 73ECh. 1.2 - Prob. 74ECh. 1.2 - Prob. 75ECh. 1.2 - Prob. 76ECh. 1.2 - Prob. 77ECh. 1.2 - Prob. 78ECh. 1.3 - Prob. 1.1CYUCh. 1.3 - Prob. 1.2CYUCh. 1.3 - Prob. 1.3CYUCh. 1.3 - Prob. 1.4CYUCh. 1.3 - Prob. 2.1CYUCh. 1.3 - Prob. 2.2CYUCh. 1.3 - Prob. 2.3CYUCh. 1.3 - Prob. 2.4CYUCh. 1.3 - Prob. 3.1CYUCh. 1.3 - Prob. 3.2CYUCh. 1.3 - Prob. 3.3CYUCh. 1.3 - Prob. 3.4CYUCh. 1.3 - Prob. 79ECh. 1.3 - Prob. 80ECh. 1.3 - Prob. 81ECh. 1.3 - Prob. 82ECh. 1.3 - Prob. 83ECh. 1.3 - Prob. 84ECh. 1.3 - Prob. 85ECh. 1.3 - Prob. 86ECh. 1.3 - Prob. 87ECh. 1.3 - Prob. 88ECh. 1.3 - Prob. 89ECh. 1.3 - Prob. 90ECh. 1.3 - Prob. 91ECh. 1.3 - Prob. 92ECh. 1.3 - Prob. 93ECh. 1.3 - Prob. 94ECh. 1.3 - Prob. 95ECh. 1.3 - Prob. 96ECh. 1.3 - Prob. 97ECh. 1.3 - Prob. 98ECh. 1.3 - Prob. 99ECh. 1.3 - Prob. 100ECh. 1.3 - Prob. 101ECh. 1.3 - Prob. 102ECh. 1.3 - Prob. 103ECh. 1.3 - Prob. 104ECh. 1.3 - Prob. 105ECh. 1.3 - Prob. 106ECh. 1.3 - Prob. 107ECh. 1.3 - Prob. 108ECh. 1.3 - Prob. 109ECh. 1.3 - Prob. 110ECh. 1.3 - Prob. 111ECh. 1.3 - Prob. 112ECh. 1.3 - Prob. 113ECh. 1 - Prob. 1CYUCh. 1 - Prob. 2CYUCh. 1 - Prob. 1ECh. 1 - Prob. 2ECh. 1 - Prob. 3ECh. 1 - Prob. 4ECh. 1 - Prob. 5ECh. 1 - Prob. 6ECh. 1 - Prob. 7ECh. 1 - Prob. 8ECh. 1 - Prob. 1CRECh. 1 - Prob. 2CRECh. 1 - Prob. 3CRECh. 1 - Prob. 4CRECh. 1 - Prob. 5CRECh. 1 - Prob. 6CRECh. 1 - Prob. 7CRECh. 1 - Prob. 8CRECh. 1 - Prob. 9CRECh. 1 - Prob. 10CRECh. 1 - Prob. 1PTCh. 1 - Prob. 2PTCh. 1 - Prob. 3PTCh. 1 - Prob. 4PTCh. 1 - Prob. 5PTCh. 1 - Prob. 6PTCh. 1 - Prob. 7PTCh. 1 - Prob. 8PTCh. 1 - Prob. 9PTCh. 1 - Prob. 10PTCh. 1 - Prob. 11PTCh. 1 - Prob. 12PTCh. 1 - Prob. 13PTCh. 1 - Prob. 14PTCh. 1 - Prob. 15PT
Knowledge Booster
Background pattern image
Statistics
Learn more about
Need a deep-dive on the concept behind this application? Look no further. Learn more about this topic, statistics and related others by exploring similar questions and additional content below.
Recommended textbooks for you
Text book image
MATLAB: An Introduction with Applications
Statistics
ISBN:9781119256830
Author:Amos Gilat
Publisher:John Wiley & Sons Inc
Text book image
Probability and Statistics for Engineering and th...
Statistics
ISBN:9781305251809
Author:Jay L. Devore
Publisher:Cengage Learning
Text book image
Statistics for The Behavioral Sciences (MindTap C...
Statistics
ISBN:9781305504912
Author:Frederick J Gravetter, Larry B. Wallnau
Publisher:Cengage Learning
Text book image
Elementary Statistics: Picturing the World (7th E...
Statistics
ISBN:9780134683416
Author:Ron Larson, Betsy Farber
Publisher:PEARSON
Text book image
The Basic Practice of Statistics
Statistics
ISBN:9781319042578
Author:David S. Moore, William I. Notz, Michael A. Fligner
Publisher:W. H. Freeman
Text book image
Introduction to the Practice of Statistics
Statistics
ISBN:9781319013387
Author:David S. Moore, George P. McCabe, Bruce A. Craig
Publisher:W. H. Freeman
The Shape of Data: Distributions: Crash Course Statistics #7; Author: CrashCourse;https://www.youtube.com/watch?v=bPFNxD3Yg6U;License: Standard YouTube License, CC-BY
Shape, Center, and Spread - Module 20.2 (Part 1); Author: Mrmathblog;https://www.youtube.com/watch?v=COaid7O_Gag;License: Standard YouTube License, CC-BY
Shape, Center and Spread; Author: Emily Murdock;https://www.youtube.com/watch?v=_YyW0DSCzpM;License: Standard Youtube License