
Videos
(a)
To interpret: the standard deviation
(a)
Answer to Problem 9CRE
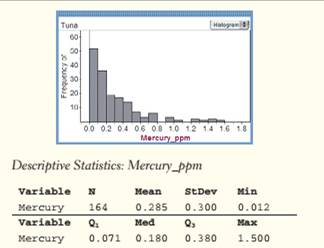
The standard deviation of the data is 0.300
Explanation of Solution
Given:
Calculation:
According to the provided table, it is clear that the standard deviation of the data is 0.300 which insures that the values of the mercury per can will vary about 0.300 from the mean
Conclusion:
Therefore, According to the provided table, it is clear that the standard deviation of the data is 0.300 which insures that the values of the mercury per can will vary about 0.300 from the mean
(b)
To identify: whether there are any outliers
(b)
Answer to Problem 9CRE
There are many upper outliers.
Explanation of Solution
Calculation:
On seeing the provided graph of the problem, it is clear that a lot of the values is lying on the right of the graph and also very far away. So, it is clear that the graph is having the outliers on the right side. The lower outlier can be calculated as below.
Now, put the values provided into the table.
Since, there is no points lies below
Now, put the values provided into the table.
Since, there is many points lies above 0.8435, hence there are many upper outliers.
Conclusion:
Therefore, there are many upper outliers.
(c)
To describe: the shape, center, and spread of the distribution.
(c)
Answer to Problem 9CRE
The shape of the graph is rightly skewed.
Center: the mean is 0.285ppm and the median is 0.180ppm
Spread: between 0.012ppm and 1.500ppm
Explanation of Solution
Calculation:
On seeing the provided graph it is clear that the shape of the graph is rightly skewed. Since, in the graph outliers exist hence the median will be the best center of the data and according to the provided table, the value of the median is 0.180. Similarly, in the case of outliers, the spread of the graph can be obtained by inter
Chapter 1 Solutions
The Practice of Statistics for AP - 4th Edition
Additional Math Textbook Solutions
STATS:DATA+MODELS-W/DVD
Introductory Statistics (2nd Edition)
Fundamentals of Statistics (5th Edition)
Essentials of Statistics (6th Edition)


 MATLAB: An Introduction with ApplicationsStatisticsISBN:9781119256830Author:Amos GilatPublisher:John Wiley & Sons Inc
 Probability and Statistics for Engineering and th...StatisticsISBN:9781305251809Author:Jay L. DevorePublisher:Cengage Learning
 Statistics for The Behavioral Sciences (MindTap C...StatisticsISBN:9781305504912Author:Frederick J Gravetter, Larry B. WallnauPublisher:Cengage Learning
 Elementary Statistics: Picturing the World (7th E...StatisticsISBN:9780134683416Author:Ron Larson, Betsy FarberPublisher:PEARSON
 The Basic Practice of StatisticsStatisticsISBN:9781319042578Author:David S. Moore, William I. Notz, Michael A. FlignerPublisher:W. H. Freeman
 Introduction to the Practice of StatisticsStatisticsISBN:9781319013387Author:David S. Moore, George P. McCabe, Bruce A. CraigPublisher:W. H. Freeman