
Concept explainers
Videos
To write:how the distribution of income changes with the highest level of education reached.
Answer to Problem 96E
Shape: the distribution is right skewed.
Center: the level of education increase, the median incomeincreases.
Spread: the
Explanation of Solution
Given:
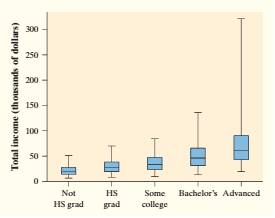
Shape: All distribution are right skewed, because the line of the median in the box of the boxplot lies more to the bottom of the boxplot and the top whiskers are longer than the bottom whiskers.
Center: As the level of education increase, we note that the median income (line in the box of the boxplot) increases.
Spread: As the level of education increases, we note that the range of the income (distance between whiskers) and the IQR(height of the box of the boxplot) increases.
Chapter 1 Solutions
The Practice of Statistics for AP - 4th Edition
Additional Math Textbook Solutions
Statistics for Psychology
Elementary Statistics: Picturing the World (6th Edition)
Basic Business Statistics, Student Value Edition (13th Edition)
Introductory Statistics (10th Edition)
Introductory Statistics (2nd Edition)


 MATLAB: An Introduction with ApplicationsStatisticsISBN:9781119256830Author:Amos GilatPublisher:John Wiley & Sons Inc
 Probability and Statistics for Engineering and th...StatisticsISBN:9781305251809Author:Jay L. DevorePublisher:Cengage Learning
 Statistics for The Behavioral Sciences (MindTap C...StatisticsISBN:9781305504912Author:Frederick J Gravetter, Larry B. WallnauPublisher:Cengage Learning
 Elementary Statistics: Picturing the World (7th E...StatisticsISBN:9780134683416Author:Ron Larson, Betsy FarberPublisher:PEARSON
 The Basic Practice of StatisticsStatisticsISBN:9781319042578Author:David S. Moore, William I. Notz, Michael A. FlignerPublisher:W. H. Freeman
 Introduction to the Practice of StatisticsStatisticsISBN:9781319013387Author:David S. Moore, George P. McCabe, Bruce A. CraigPublisher:W. H. Freeman