
Videos
(a)
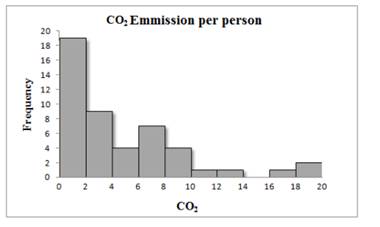
To make: a histogram using classes of width 2, starting at 0.
(b) Describe the shape, center, and spread of the distribution. Which countries are outliers?
(a)
Answer to Problem 54E

Explanation of Solution
Given:
| Country | CO2 | Country | CO2 | Country | CO2 | Country | CO2 |
| Algeria | 2.6 | Egypt | 2.0 | Italy | 7.8 | Romania | 4.2 |
| Argentina | 3.6 | Ethiopia | 0.1 | Japan | 9.5 | Russia | 10.8 |
| Australia | 18.4 | France | 6.2 | Kenya | 0.3 | Saudi Arabia | 13.8 |
| Bangladesh | 0.3 | Germany | 9.9 | Korea, North | 3.3 | South Africa | 7.0 |
| Brazil | 1.8 | Ghana | 0.3 | Korea, South | 9.3 | Spain | 7.9 |
| Canada | 17.0 | India | 1.1 | Malaysia | 5.5 | Sudan | 0.3 |
| China | 3.9 | Indonesia | 1.6 | Mexico | 3.7 | Tanzania | 0.1 |
| Colombia | 1.3 | Iran | 6.0 | Morocco | 1.4 | Thailand | 3.3 |
| Congo | 0.2 | Iraq | 2.9 | Myanmar | 0.2 | Turkey | 3.0 |
| Country | CO2 | Country | CO2 |
| Italy | 7.8 | Romania | 4.2 |
| Japan | 9.5 | Russia | 10.8 |
| Kenya | 0.3 | Saudi Arabia | 13.8 |
| Korea, North | 3.3 | South Africa | 7.0 |
| Korea, South | 9.3 | Spain | 7.9 |
| Malaysia | 5.5 | Sudan | 0.3 |
| Mexico | 3.7 | Tanzania | 0.1 |
| Morocco | 1.4 | Thailand | 3.3 |
| Myanmar | 0.2 | Turkey | 3.0 |
| Nepal | 0.1 | Ukraine | 6.3 |
| Nigeria | 0.4 | United Kingdom | 8.8 |
| Pakistan | 0.8 | United States | 19.6 |
| Peru | 1.0 | Uzbekistan | 4.2 |
| Philippines | 0.9 | Venezuela | 5.4 |
| Poland | 7.8 | Vietnam | 1.0 |
Calculation:
The Histogram of Carbon dioxide emission per person from countries with population of at least 20 million6 is below:
Conclusion:
Thus, a histogram is made for the given data.
(b)
To describe: the shape, center, spread and outliers
(b)
Answer to Problem 54E
Shape: skewed to the right
Center: between 2 and 4 metric tons per person
Spread: 0.1 to 19.5metric tons per person
Outliers: Australia, Canada and the US
Explanation of Solution
The shape is irregular and asymmetric.lt is skewed towards one side. It seems closer to the right skewed.
The centre of data is approximately between 4 to 5 metric tons emission per person. There is three outlier that is 17, 18.4,and 19.6
Therefore, the data is approximately follows skewed distribution.
With 17 metric tons emission per person, with 18.4 metric tons emission per person and US with 19.6 metric tons emission per person are the outliers in the data.
Chapter 1 Solutions
The Practice of Statistics for AP - 4th Edition
Additional Math Textbook Solutions
Statistics for Business and Economics (13th Edition)
Introductory Statistics (2nd Edition)
Introductory Statistics
Introductory Statistics (10th Edition)
Elementary Statistics (13th Edition)


 MATLAB: An Introduction with ApplicationsStatisticsISBN:9781119256830Author:Amos GilatPublisher:John Wiley & Sons Inc
 Probability and Statistics for Engineering and th...StatisticsISBN:9781305251809Author:Jay L. DevorePublisher:Cengage Learning
 Statistics for The Behavioral Sciences (MindTap C...StatisticsISBN:9781305504912Author:Frederick J Gravetter, Larry B. WallnauPublisher:Cengage Learning
 Elementary Statistics: Picturing the World (7th E...StatisticsISBN:9780134683416Author:Ron Larson, Betsy FarberPublisher:PEARSON
 The Basic Practice of StatisticsStatisticsISBN:9781319042578Author:David S. Moore, William I. Notz, Michael A. FlignerPublisher:W. H. Freeman
 Introduction to the Practice of StatisticsStatisticsISBN:9781319013387Author:David S. Moore, George P. McCabe, Bruce A. CraigPublisher:W. H. Freeman