
Concept explainers
Videos
(a)
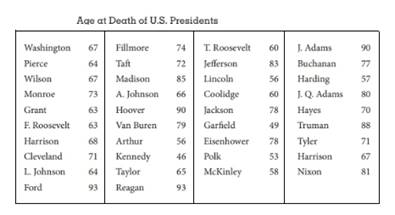
To construct: the stem plot on the basis of given data.
(a)
Explanation of Solution
Given:
Graph:
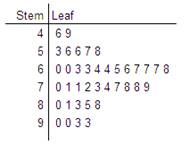
By seeing the stem-leaf plot minimum and maximum values are 46 and 93 respectively so the spread of the data will be 46 to 93. Median is at 69 and 1st
(b)
To construct: the histogram on the basis of given data and explain the shape, centre and spread of the distribution and about the outlier.
(b)
Explanation of Solution
Given:
Graph:
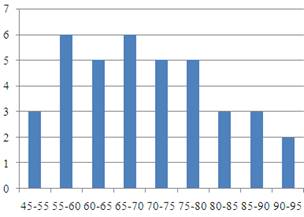
The representing the histogram looks symmetric because of centre in the middle and median would be around 70 to 75 while the minimum and maximum values are 45 and 98 respectively so the spread of the data would be between 45 and 48.
(c)
To Explain: that which plot is better a stem plot or histogram.
(c)
Answer to Problem 2.67RE
Histogram
Explanation of Solution
By seeing the both the plot, it is observed that pattern of both the plot is approximately similar but the pattern of histogram is better than stem plot because the stem plot lies in its favour compared to the histogram.
Want to see more full solutions like this?
Chapter 2 Solutions
Statistics Through Applications
Additional Math Textbook Solutions
Introductory Statistics (2nd Edition)
Intro Stats
Fundamentals of Statistics (5th Edition)
Elementary Statistics
An Introduction to Mathematical Statistics and Its Applications (6th Edition)
Elementary Statistics Using Excel (6th Edition)


 MATLAB: An Introduction with ApplicationsStatisticsISBN:9781119256830Author:Amos GilatPublisher:John Wiley & Sons Inc
 Probability and Statistics for Engineering and th...StatisticsISBN:9781305251809Author:Jay L. DevorePublisher:Cengage Learning
 Statistics for The Behavioral Sciences (MindTap C...StatisticsISBN:9781305504912Author:Frederick J Gravetter, Larry B. WallnauPublisher:Cengage Learning
 Elementary Statistics: Picturing the World (7th E...StatisticsISBN:9780134683416Author:Ron Larson, Betsy FarberPublisher:PEARSON
 The Basic Practice of StatisticsStatisticsISBN:9781319042578Author:David S. Moore, William I. Notz, Michael A. FlignerPublisher:W. H. Freeman
 Introduction to the Practice of StatisticsStatisticsISBN:9781319013387Author:David S. Moore, George P. McCabe, Bruce A. CraigPublisher:W. H. Freeman