
Concept explainers
Videos
To construct: stem plot on the basis of given data and describe the shape, centre, spread of the distribution and about the outliers.
Explanation of Solution
Given:
166.5 170 178 163 150.5 169 173 169 171 166 190 183 178 161
171 170 191 168.5 178.5 173 175 160.5 166 164 163 174 160 174
182 167 166 170 170 181 171.5 160 178 157 165 187 168 157.5
145.5 156 182 168.5 177 162.5 160.5 185.5
Graph:
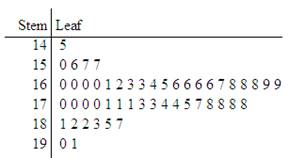
By seeing the stem plot centre is at 169.25 and 1st
Chapter 2 Solutions
Statistics Through Applications
Additional Math Textbook Solutions
Elementary Statistics Using Excel (6th Edition)
Introductory Statistics (2nd Edition)
Introductory Statistics (10th Edition)
Introductory Statistics
Elementary Statistics: Picturing the World (6th Edition)
Elementary Statistics: Picturing the World (7th Edition)


 MATLAB: An Introduction with ApplicationsStatisticsISBN:9781119256830Author:Amos GilatPublisher:John Wiley & Sons Inc
 Probability and Statistics for Engineering and th...StatisticsISBN:9781305251809Author:Jay L. DevorePublisher:Cengage Learning
 Statistics for The Behavioral Sciences (MindTap C...StatisticsISBN:9781305504912Author:Frederick J Gravetter, Larry B. WallnauPublisher:Cengage Learning
 Elementary Statistics: Picturing the World (7th E...StatisticsISBN:9780134683416Author:Ron Larson, Betsy FarberPublisher:PEARSON
 The Basic Practice of StatisticsStatisticsISBN:9781319042578Author:David S. Moore, William I. Notz, Michael A. FlignerPublisher:W. H. Freeman
 Introduction to the Practice of StatisticsStatisticsISBN:9781319013387Author:David S. Moore, George P. McCabe, Bruce A. CraigPublisher:W. H. Freeman