
Concept explainers
Videos
(a)
To Calculate: the median and explain the meaning of this means in this setting.
(a)
Answer to Problem 2.28E
Explanation of Solution
Given:
93 93 87.5 91 94.5 72 96 95 93.5 93.5 73 82 45 88 80
86 85.5 87.5 81 78 86 89 92 91 98 85 82.5 88 94.5 43
Formula used:
Calculation:
Order the number in ascending order
43 45 72 73 78 80 81 82 82.5 85 85.5 86 86 87.5 87.5
88 88 88 89 91 91 92 93 93.5 93.5 94.5 94.5 95 96 98
I
The median or 2nd
(b)
To Calculate: the quartiles and IQR and interpret meaning of IQR in this setting.
(b)
Answer to Problem 2.28E
Explanation of Solution
Given:
43 45 72 73 78 80 81 82 82.5 85 85.5 86 86 87.5 87.5
88 88 88 89 91 91 92 93 93.5 93.5 94.5 94.5 95 96 98
Formula used:
Calculation:
IQR stands for inter
(c)
To Explain: that is there outlier and justifies the answer.
(c)
Answer to Problem 2.28E
43 and 45 are extremely high outliers.
Explanation of Solution
Given:
43 45 72 73 78 80 81 82 82.5 85 85.5 86 86 87.5 87.5
88 88 88 89 91 91 92 93 93.5 93.5 94.5 94.5 95 96 98
Formula used:
For greater than
For lesser than
Calculation:
An outlier is an extremely high or extremely low value in the data set. It can be identify an outlier if it is greater than
(d)
To construct: the box plot on the basis of given data.
(d)
Explanation of Solution
Given:
93 93 87.5 91 94.5 72 96 95 93.5 93.5 73 82 45 88 80
86 85.5 87.5 81 78 86 89 92 91 98 85 82.5 88 94.5 43
Graph:
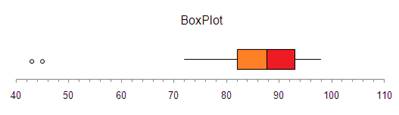
By seeing the box plot it is clearly observed that there are 2 high outliers which are 43 and 45 and the 1st quartile and 3rd quartile are about 81 and 93 respectively and the median is about 88 which are looking forth.
Chapter 2 Solutions
Statistics Through Applications
Additional Math Textbook Solutions
Elementary Statistics
Elementary Statistics: Picturing the World (7th Edition)
Elementary Statistics: Picturing the World (6th Edition)
Fundamentals of Statistics (5th Edition)
Introductory Statistics
Statistical Reasoning for Everyday Life (5th Edition)


 MATLAB: An Introduction with ApplicationsStatisticsISBN:9781119256830Author:Amos GilatPublisher:John Wiley & Sons Inc
 Probability and Statistics for Engineering and th...StatisticsISBN:9781305251809Author:Jay L. DevorePublisher:Cengage Learning
 Statistics for The Behavioral Sciences (MindTap C...StatisticsISBN:9781305504912Author:Frederick J Gravetter, Larry B. WallnauPublisher:Cengage Learning
 Elementary Statistics: Picturing the World (7th E...StatisticsISBN:9780134683416Author:Ron Larson, Betsy FarberPublisher:PEARSON
 The Basic Practice of StatisticsStatisticsISBN:9781319042578Author:David S. Moore, William I. Notz, Michael A. FlignerPublisher:W. H. Freeman
 Introduction to the Practice of StatisticsStatisticsISBN:9781319013387Author:David S. Moore, George P. McCabe, Bruce A. CraigPublisher:W. H. Freeman