
Videos
To Explain: the shape, centre and spread of this distribution.
Explanation of Solution
Given:
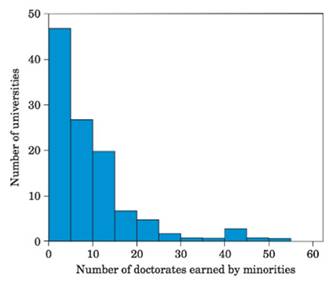
By seeing the histogram the minimum and maximum values of doctorate are 0 and 55 respectively so the spread of the data is between 0 and 55. The data is skewed to the right or positive skewed because most of the data is centred to the left of the graph. The centre will be in the second bar between 5 and 10 doctorates and
Chapter 2 Solutions
Statistics Through Applications
Additional Math Textbook Solutions
Basic Business Statistics, Student Value Edition (13th Edition)
Statistics for Business and Economics (13th Edition)
Elementary Statistics: Picturing the World (6th Edition)
Elementary Statistics Using Excel (6th Edition)
Intro Stats, Books a la Carte Edition (5th Edition)
Introductory Statistics (10th Edition)


 MATLAB: An Introduction with ApplicationsStatisticsISBN:9781119256830Author:Amos GilatPublisher:John Wiley & Sons Inc
 Probability and Statistics for Engineering and th...StatisticsISBN:9781305251809Author:Jay L. DevorePublisher:Cengage Learning
 Statistics for The Behavioral Sciences (MindTap C...StatisticsISBN:9781305504912Author:Frederick J Gravetter, Larry B. WallnauPublisher:Cengage Learning
 Elementary Statistics: Picturing the World (7th E...StatisticsISBN:9780134683416Author:Ron Larson, Betsy FarberPublisher:PEARSON
 The Basic Practice of StatisticsStatisticsISBN:9781319042578Author:David S. Moore, William I. Notz, Michael A. FlignerPublisher:W. H. Freeman
 Introduction to the Practice of StatisticsStatisticsISBN:9781319013387Author:David S. Moore, George P. McCabe, Bruce A. CraigPublisher:W. H. Freeman