
Videos
(a)
To construct: the dot plot on the basis of given data.
(a)
Explanation of Solution
Given:
| 5 | 0 | 1 | 0 | 7 | 2 | 1 | 0 | 4 | 0 | 3 | 0 | 2 | 0 |
| 3 | 1 | 5 | 0 | 3 | 0 | 1 | 0 | 1 | 0 | 2 | 0 | 3 | 1 |
Graph:
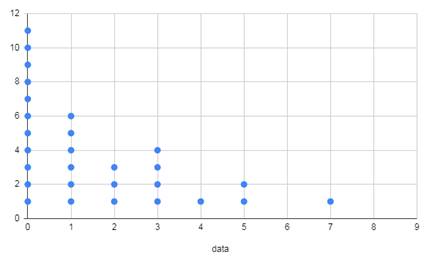
By seeing the dot plot it is clearly show that it is right skewed because highest dot on the left side and the
(b)
To Explain: the distribution of the variable and shape, centre and spread.
(b)
Explanation of Solution
By seeing the dot plot, most of the data points are on the left side and little dot plots on the right side so the distribution is right skewed. Maximum dot plots on 0 so mode is 0. The center lies at 1 and the minimum and maximum values are 0 and 7 respectively so the data spread between 0 and 7. Inter
Chapter 2 Solutions
Statistics Through Applications
Additional Math Textbook Solutions
Elementary Statistics (13th Edition)
Introductory Statistics (2nd Edition)
Elementary Statistics: Picturing the World (6th Edition)
STATS:DATA+MODELS-W/DVD
An Introduction to Mathematical Statistics and Its Applications (6th Edition)
Fundamentals of Statistics (5th Edition)


 MATLAB: An Introduction with ApplicationsStatisticsISBN:9781119256830Author:Amos GilatPublisher:John Wiley & Sons Inc
 Probability and Statistics for Engineering and th...StatisticsISBN:9781305251809Author:Jay L. DevorePublisher:Cengage Learning
 Statistics for The Behavioral Sciences (MindTap C...StatisticsISBN:9781305504912Author:Frederick J Gravetter, Larry B. WallnauPublisher:Cengage Learning
 Elementary Statistics: Picturing the World (7th E...StatisticsISBN:9780134683416Author:Ron Larson, Betsy FarberPublisher:PEARSON
 The Basic Practice of StatisticsStatisticsISBN:9781319042578Author:David S. Moore, William I. Notz, Michael A. FlignerPublisher:W. H. Freeman
 Introduction to the Practice of StatisticsStatisticsISBN:9781319013387Author:David S. Moore, George P. McCabe, Bruce A. CraigPublisher:W. H. Freeman