
Videos
(a)
To Explain: that the graph is misleading.
(a)
Explanation of Solution
Given:
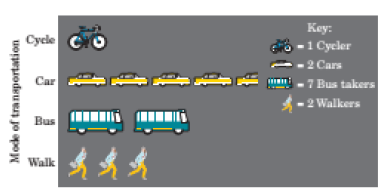
By seeing the graph, it is observed that the bars are not proportional according to the data which is given. Cars are worth higher compared to the cycler and bus is worth lower compared to any other objects in this way graph is misleading.
(b)
To construct: the graph of the data which is not misleading.
(b)
Explanation of Solution
Given:

Graph:
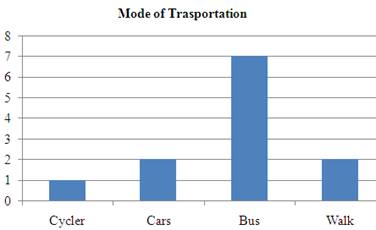
By seeing the graph, it is observed that there transportation of maximum is of bus and the minimum transportation is of cycle for the students and other transportation of cars and walk is below average.
Chapter 2 Solutions
Statistics Through Applications
Additional Math Textbook Solutions
Basic Business Statistics, Student Value Edition
Essentials of Statistics (6th Edition)
Introductory Statistics
Intro Stats, Books a la Carte Edition (5th Edition)
Elementary Statistics
Fundamentals of Statistics (5th Edition)


 MATLAB: An Introduction with ApplicationsStatisticsISBN:9781119256830Author:Amos GilatPublisher:John Wiley & Sons Inc
 Probability and Statistics for Engineering and th...StatisticsISBN:9781305251809Author:Jay L. DevorePublisher:Cengage Learning
 Statistics for The Behavioral Sciences (MindTap C...StatisticsISBN:9781305504912Author:Frederick J Gravetter, Larry B. WallnauPublisher:Cengage Learning
 Elementary Statistics: Picturing the World (7th E...StatisticsISBN:9780134683416Author:Ron Larson, Betsy FarberPublisher:PEARSON
 The Basic Practice of StatisticsStatisticsISBN:9781319042578Author:David S. Moore, William I. Notz, Michael A. FlignerPublisher:W. H. Freeman
 Introduction to the Practice of StatisticsStatisticsISBN:9781319013387Author:David S. Moore, George P. McCabe, Bruce A. CraigPublisher:W. H. Freeman