
Concept explainers
Videos
To Explain: the overall pattern of the dot plot.
Explanation of Solution
Given:
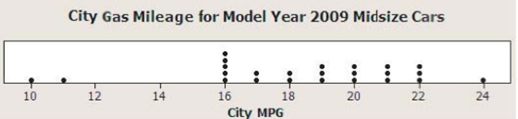
By seeing the dot plot centre is at 19 and 1st
Chapter 2 Solutions
Statistics Through Applications
Additional Math Textbook Solutions
Statistics for Business and Economics (13th Edition)
Elementary Statistics: Picturing the World (6th Edition)
Fundamentals of Statistics (5th Edition)
Introductory Statistics (2nd Edition)
Introductory Statistics (10th Edition)
Essentials of Statistics, Books a la Carte Edition (5th Edition)


 MATLAB: An Introduction with ApplicationsStatisticsISBN:9781119256830Author:Amos GilatPublisher:John Wiley & Sons Inc
 Probability and Statistics for Engineering and th...StatisticsISBN:9781305251809Author:Jay L. DevorePublisher:Cengage Learning
 Statistics for The Behavioral Sciences (MindTap C...StatisticsISBN:9781305504912Author:Frederick J Gravetter, Larry B. WallnauPublisher:Cengage Learning
 Elementary Statistics: Picturing the World (7th E...StatisticsISBN:9780134683416Author:Ron Larson, Betsy FarberPublisher:PEARSON
 The Basic Practice of StatisticsStatisticsISBN:9781319042578Author:David S. Moore, William I. Notz, Michael A. FlignerPublisher:W. H. Freeman
 Introduction to the Practice of StatisticsStatisticsISBN:9781319013387Author:David S. Moore, George P. McCabe, Bruce A. CraigPublisher:W. H. Freeman