
Concept explainers
Videos
(a)
To Explain: that is it possible to use a pie chart on the basis of given data, explain it
(a)
Answer to Problem 2.5E
Not possible
Explanation of Solution
Given:
| Gen. Y | Gen. X | Baby boomers | Matures |
| 86% | 79% | 76% | 48% |
Here is given result about cell phone use and driving by age groups in percentages if adding all the percentage of given subject total of all is 289 % which is not equal to 100% that is the reason that pie chart cannot be used which requirement is percentage should be 100%.
(b)
To construct: the bar graph on the basis of given data and explain it
(b)
Explanation of Solution
Given:
| Gen. Y | Gen. X | Baby boomers | Matures |
| 86% | 79% | 76% | 48% |
Graph:
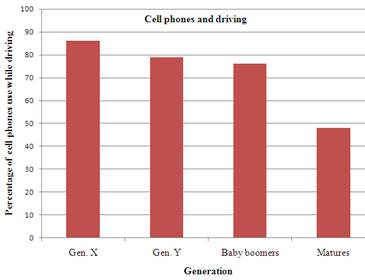
This is the graph between percentage of cell phones use while driving and Generation where highest bar is of Gen X It means that Gen X is using the highest cell phones use while driving and lowest bar is of matures it means that Matures is using the lowest cell phones use while driving and other two coming in between them.
Chapter 2 Solutions
Statistics Through Applications
Additional Math Textbook Solutions
Statistical Reasoning for Everyday Life (5th Edition)
Introductory Statistics
Introductory Statistics (2nd Edition)
Essentials of Statistics (6th Edition)
Elementary Statistics: Picturing the World (7th Edition)
An Introduction to Mathematical Statistics and Its Applications (6th Edition)


 MATLAB: An Introduction with ApplicationsStatisticsISBN:9781119256830Author:Amos GilatPublisher:John Wiley & Sons Inc
 Probability and Statistics for Engineering and th...StatisticsISBN:9781305251809Author:Jay L. DevorePublisher:Cengage Learning
 Statistics for The Behavioral Sciences (MindTap C...StatisticsISBN:9781305504912Author:Frederick J Gravetter, Larry B. WallnauPublisher:Cengage Learning
 Elementary Statistics: Picturing the World (7th E...StatisticsISBN:9780134683416Author:Ron Larson, Betsy FarberPublisher:PEARSON
 The Basic Practice of StatisticsStatisticsISBN:9781319042578Author:David S. Moore, William I. Notz, Michael A. FlignerPublisher:W. H. Freeman
 Introduction to the Practice of StatisticsStatisticsISBN:9781319013387Author:David S. Moore, George P. McCabe, Bruce A. CraigPublisher:W. H. Freeman