
Concept explainers
Videos
To construct: the box plot on basis of given data and describe the distribution.
Explanation of Solution
Given:
3 0 12 10 8 4 2 7 10 11 6 7 0 35 12 3 10 2 7 9 15 5 14 15 6
Formula used:
Calculation:
Order the numbers in ascending order
0 0 2 2 3 3 4 5 6 6 7 7 7 8 9 10 10 10 11 12 12 14 15 15 35
For outliers
Graph:
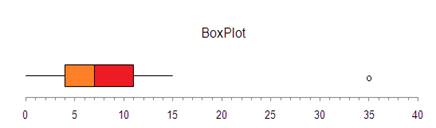
By seeing the stem plot centre is at 7 and 1st quartile and 3rd quartile are 3.5 and 11.5 respectively. Inter quartile range is 8 and the minimum and maximum values are 0 and 35 respectively so the spread of the data is between 0 and 35 and the mode which is 10 because of highest frequency of the number. There is one outlier and distribution is positive skewed or right skewed which looking forth.
Chapter 2 Solutions
Statistics Through Applications
Additional Math Textbook Solutions
Introductory Statistics (2nd Edition)
STATS:DATA+MODELS-W/DVD
Essentials of Statistics (6th Edition)
Essentials of Statistics, Books a la Carte Edition (5th Edition)
Statistics for Business and Economics (13th Edition)


 MATLAB: An Introduction with ApplicationsStatisticsISBN:9781119256830Author:Amos GilatPublisher:John Wiley & Sons Inc
 Probability and Statistics for Engineering and th...StatisticsISBN:9781305251809Author:Jay L. DevorePublisher:Cengage Learning
 Statistics for The Behavioral Sciences (MindTap C...StatisticsISBN:9781305504912Author:Frederick J Gravetter, Larry B. WallnauPublisher:Cengage Learning
 Elementary Statistics: Picturing the World (7th E...StatisticsISBN:9780134683416Author:Ron Larson, Betsy FarberPublisher:PEARSON
 The Basic Practice of StatisticsStatisticsISBN:9781319042578Author:David S. Moore, William I. Notz, Michael A. FlignerPublisher:W. H. Freeman
 Introduction to the Practice of StatisticsStatisticsISBN:9781319013387Author:David S. Moore, George P. McCabe, Bruce A. CraigPublisher:W. H. Freeman