Introduction To Statistics And Data Analysis
6th Edition
ISBN: 9781337793612
Author: PECK, Roxy.
Publisher: Cengage Learning,
bartleby

Concept explainers

bartleby

Videos

Textbook Question
Book Icon
Chapter 3, Problem 13CRE

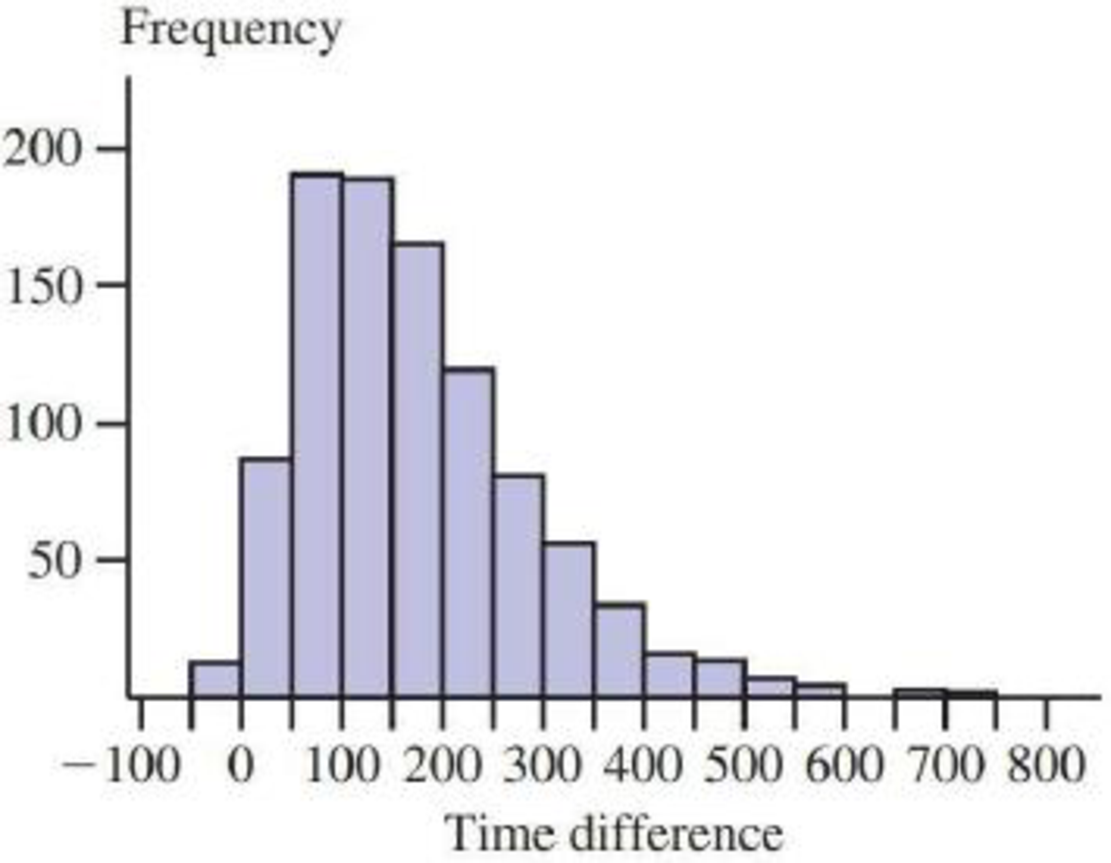
How does the speed of a runner vary over the course of a marathon (a distance of 42.195 km)? Consider determining both the time (in seconds) to run the first 5 km and the time (in seconds) to run between the 35 km and 40 km points, and then subtracting the 5-km time from the 35–40-km time. A positive value of this difference corresponds to a runner slowing down toward the end of the race. The histogram below is based on times of runners who participated in several different Japanese marathons (“Factors Affecting Runners’ Marathon Performance,” Chance [Fall 1993]: 24–30).

  1. a. What are some interesting features of this histogram?
  2. b. What is a typical difference value?
  3. c. Roughly what proportion of the runners ran the late distance more quickly than the early distance?

Chapter 3, Problem 13CRE, How does the speed of a runner vary over the course of a marathon (a distance of 42.195 km)?

Blurred answer

Chapter 3 Solutions

Introduction To Statistics And Data Analysis

Ch. 3.1 - During 2017, Gallup conducted a survey of adult...Ch. 3.1 - An article about college loans (New Rules Would...Ch. 3.1 - The report Findings From the 2014 College Senior...Ch. 3.2 - The National Center for Health Statistics provided...Ch. 3.2 - The paper State-Level Cancer Mortality...Ch. 3.2 - The accompanying data on seat belt use for each of...Ch. 3.2 - The previous exercise gave data on seat belt use...Ch. 3.2 - The U.S. Department of Health and Human Services...Ch. 3.2 - The article Economy Low, Generosity High (USA...Ch. 3.2 - The U.S. gasoline tax per gallon data for each of...Ch. 3.2 - A report from Texas Transportation Institute...Ch. 3.2 - The percentage of teens not in school or working...Ch. 3.3 - The data in the accompanying table are from the...Ch. 3.3 - The accompanying data on annual maximum wind speed...Ch. 3.3 - The accompanying relative frequency table is based...Ch. 3.3 - The data in the accompanying table represents the...Ch. 3.3 - Construct a histogram for the data in the previous...Ch. 3.3 - The following two relative frequency distributions...Ch. 3.3 - U.S. Census data for San Luis Obispo County,...Ch. 3.3 - Use the commute time data given in the previous...Ch. 3.3 - The report Trends in College Pricing 2012...Ch. 3.3 - An exam is given to students in an introductory...Ch. 3.3 - The accompanying frequency distribution summarizes...Ch. 3.3 - Example 3.19 used annual rainfall data for...Ch. 3.3 - Use the relative frequency distribution...Ch. 3.3 - Prob. 37ECh. 3.3 - Use the cumulative relative frequencies given in...Ch. 3.3 - Using the five class intervals 100 to 120, 120 to...Ch. 3.4 - The accompanying table gives data from a survey of...Ch. 3.4 - Consumer Reports Health (consumerreports.org) gave...Ch. 3.4 - Consumer Reports rated 29 fitness trackers (such...Ch. 3.4 - Consumer Reports (consumerreports.org) rated 37...Ch. 3.4 - The Solid Waste Management section of the...Ch. 3.4 - The report Daily Cigarette Use: Indicators on...Ch. 3.4 - The accompanying time series plot of movie box...Ch. 3.5 - The accompanying comparative bar chart is similar...Ch. 3.5 - The figure at the top left of the next page is...Ch. 3.5 - The figure at the top right of the next page is...Ch. 3.5 - The two graphical displays below are similar to...Ch. 3.5 - The following graphical display is similar to one...Ch. 3.5 - Explain why the following graphical display...Ch. 3 - Each year, The Princeton Review conducts surveys...Ch. 3 - Prob. 55CRCh. 3 - Prob. 56CRCh. 3 - Prob. 57CRCh. 3 - Prob. 58CRCh. 3 - Does the size of a transplanted organ matter? A...Ch. 3 - Prob. 60CRCh. 3 - The article Tobacco and Alcohol Use in G-Rated...Ch. 3 - Prob. 62CRCh. 3 - Prob. 63CRCh. 3 - Many nutritional experts have expressed concern...Ch. 3 - Americium 241 (241Am) is a radioactive material...Ch. 3 - Does eating broccoli reduce the risk of prostate...Ch. 3 - An article that appeared in USA TODAY (August 11,...Ch. 3 - Sometimes samples are composed entirely of...Ch. 3 - Prob. 4CRECh. 3 - More than half of Californias doctors say they are...Ch. 3 - Based on observing more than 400 drivers in the...Ch. 3 - An article from the Associated Press (May 14,...Ch. 3 - Prob. 8CRECh. 3 - Prob. 9CRECh. 3 - Prob. 10CRECh. 3 - The article Determination of Most Representative...Ch. 3 - The paper Lessons from Pacemaker Implantations...Ch. 3 - How does the speed of a runner vary over the...Ch. 3 - Prob. 14CRECh. 3 - One factor in the development of tennis elbow, a...Ch. 3 - An article that appeared in USA TODAY (September...
Knowledge Booster
Background pattern image
Statistics
Learn more about
Need a deep-dive on the concept behind this application? Look no further. Learn more about this topic, statistics and related others by exploring similar questions and additional content below.
Recommended textbooks for you
Text book image
Algebra & Trigonometry with Analytic Geometry
Algebra
ISBN:9781133382119
Author:Swokowski
Publisher:Cengage
The Shape of Data: Distributions: Crash Course Statistics #7; Author: CrashCourse;https://www.youtube.com/watch?v=bPFNxD3Yg6U;License: Standard YouTube License, CC-BY
Shape, Center, and Spread - Module 20.2 (Part 1); Author: Mrmathblog;https://www.youtube.com/watch?v=COaid7O_Gag;License: Standard YouTube License, CC-BY
Shape, Center and Spread; Author: Emily Murdock;https://www.youtube.com/watch?v=_YyW0DSCzpM;License: Standard Youtube License