
Videos
The National Center for Health Statistics provided the data in the accompanying table in the report “National Vital Statistics Report”(January 5, 2017, cdc.gov/nchs/data/nvsr/nvsr66/nvsr66_01.
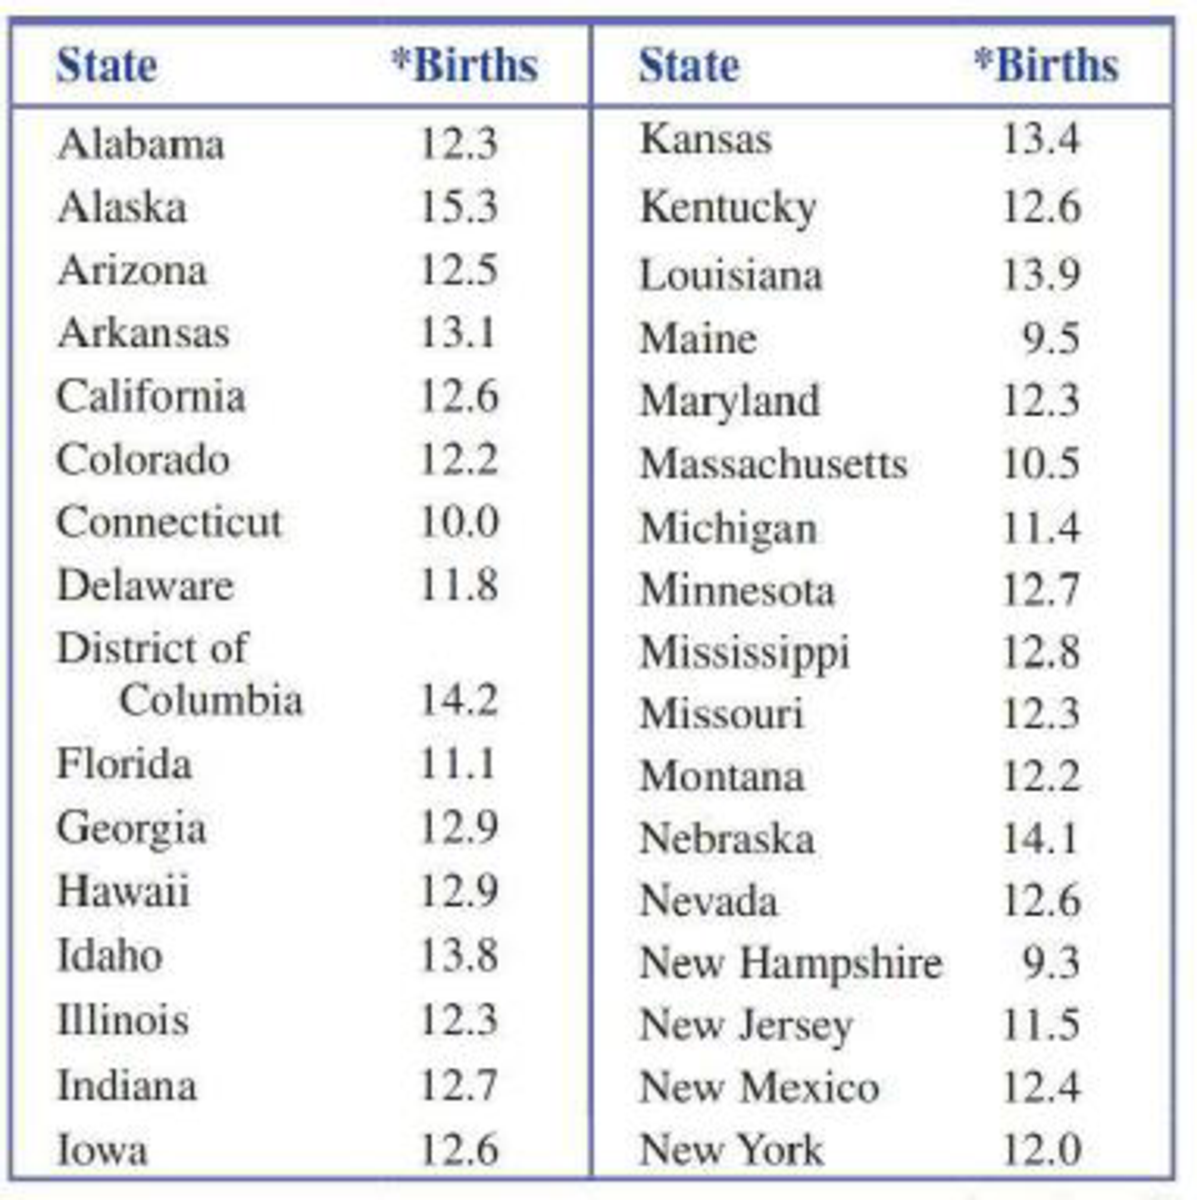
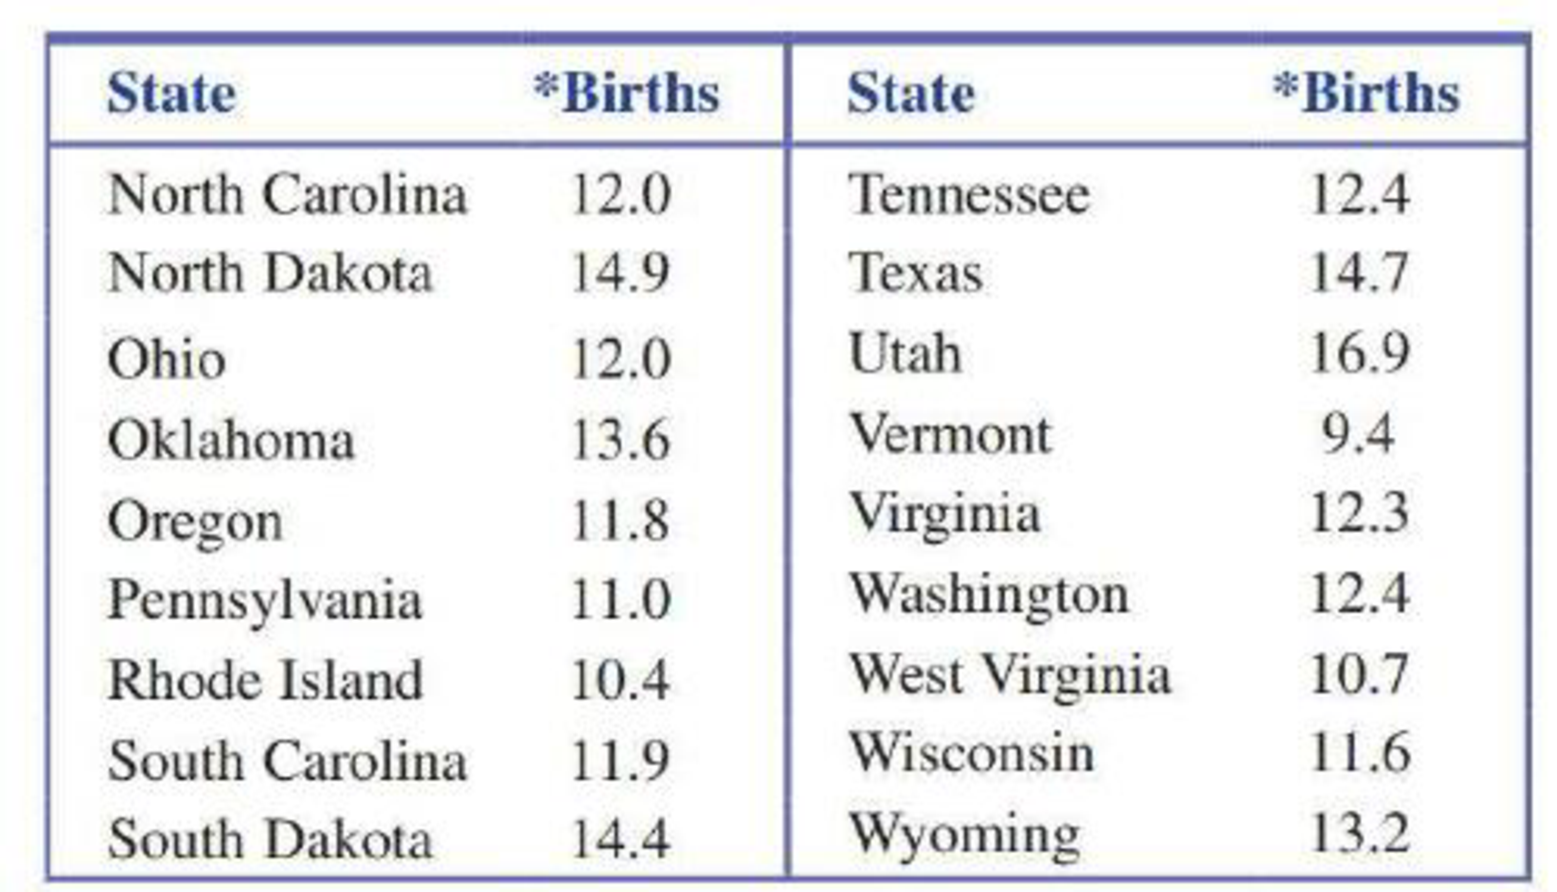
*Births per 1000 of population
Construct a stem-and-leaf display using stems 9, 10, 11…, 16. Comment on the interesting features of the display. (Hint: See Example 3. 9.)
Want to see the full answer?
Check out a sample textbook solution
Chapter 3 Solutions
Introduction To Statistics And Data Analysis
Additional Math Textbook Solutions
Stats: Modeling the World Nasta Edition Grades 9-12
Essential Statistics
Applied Statistics in Business and Economics
Elementary Statistics (Text Only)
Statistics Through Applications
An Introduction to Mathematical Statistics and Its Applications (6th Edition)


- Each year, marketing and information firm J.D. Power and Associates surveys new car owners 90 days after they have purchased their cars. The data collected are used to rate auto brands (Toyota, Ford, and others) on initial quality and initial customer satisfaction. USA Today reported both the number of manufacturing defects per 100 vehicles and a satisfaction score for all 33 brands sold in the United States.† A research group decides to compare the mean number of defects for 2 specific models of cars, A and B, made this year by taking random samples of 100 cars of each model. (a) After collecting the data, the research group calculates a 95% confidence interval to estimate the difference in population means. In this case, what is the population? all cars for models A and B that were produced this yearthe defects all cars made this yearthe 100 cars from each model (b) Suppose the calculated confidence interval is (84, 92) number of defects. What is the value of the point…arrow_forwardIron is an essential nutrient. Iron deficiency has beenlinked with symptoms such as anemia, rapid heartbeat,increased risk of infections, and lightheadedness. At theother end of the spectrum is iron overload, describedin an August 2012 New York Times article. Excess ironis deposited in the liver, heart, and pancreas and cancause cirrhosis, liver cancer, cardiac arrhythmias, anddiabetes. According to a Framingham Heart Studyresearcher, “About one person in 250 inherits a geneticdisorder called hemochromatosis that increases ironabsorption and results in a gradual, organ-damagingbuildup of stored iron.” Suppose we have a random sample of 1000 adults, and want to find the probabil-ity that at least 5 of them have this disorder. Which of these statements is true? I. We would expect 4 of these people to have hemo-chromatosis. II. We can calculate this probability using a Binomialmodel.III. We can approximate this probability using a Normalmodel.A) None B) I only C) I and II onlyD) I and III…arrow_forwardA data set from a study that examined the effect of a specific diet on blood pressure is provided . Participants (n = 72) were randomly assigned either to a group that was put on the diet (Diet = Present) or to a group that was not put on the diet (Diet = Absent), and researchers wanted to know whether the diet had a significant impact on blood pressure. Fully interpret the results in the context of this study (i.e., report the conclusions as related to the research question).arrow_forward
- The U.S. Census Bureau computes quarterly vacancy and homeownership rates by state and metropolitan statistical area. Each metropolitan statistical area has at least one urbanized area of 50,000 or more inhabitants. The data in Sheet 10 are the rental vacancy rates (%) for metropolitan statistical area in four geographic regions of the U.S. for the first quarter of 2008. Use alpha = 0.05 to test whether the mean vacancy rate is the same for each geographic region. Sheet 10 Midwest Northeast South West 16,2 2,7 16,6 7,9 10,1 11,5 8,5 6,6 8,6 6,6 12,1 6,9 12,3 7,9 9,8 5,6 10 5,3 9,3 4,3 16,9 10,7 9,1 15,2 16,9 8,6 5,6 5,7 5,4 5,5 9,4 4 18,1 12,7 11,6 12,3 11,9 8,3 15,6 3,6 11 6,7 18,3 11 9,6 14,2 13,4 12,1 7,6 1,7 6,5 8,7 12,9 3,6 11,4 5 12,2 11,5 13,1 4,7 13,6 16,3 4,4 3,3 8,2 3,4 24 5,5 12,2 22,6 12 14,5 12,6 9,5 10,1 Select one: a) Sum of Squares Between Groups = 376.87 >…arrow_forwardAn orthopedic surgeon observes that many of his patients coming in for total knee replacement surgery played organized sports before the age of 10. He plans to collect more extensive data on participation in organized sports from four patients undergoing knee replacement surgery and to report the findings. Identify the type of study proposed.arrow_forwardThe Joint Commission on Accreditation of Healthcare Organizations mandated that hospitals ban smoking by 1994. To study the effects of this ban on smoking behaviors, subjects were randomly selected from two different populations: those from hospitals with the ban and those from hospitals without the ban. Investigators were interested in determining if this smoking ban had any impact on the proportion of smokers employed at each hospital that then quit smoking. Let px be the proportion of smokers from hospitals that implemented the ban who quit smoking during the study period. Let py be the proportions of smokers from hospitals without the ban who quit smoking during the study period. Please select the appropriate hypotheses. H0: px = 0.50 HA: px ≠ 0.50 H0: px-py ≥ 0 HA: px-py H0: px-py ≤ 0 HA: px-py > 0 H0: px-py = 0 HA: px-py ≠ 0arrow_forward
- A report by the Gallup Poll stated that on average a woman visits her physician 5.8 times a year. A researcher randomly selects 20 women and obtained onto the data below.arrow_forwardCadmium, a heavy metal, is toxic to animals. Mushrooms, however, are able to absorb and accumulate cadmium at high concentrations. The Czech and Slovak governments have set a safety limit for cadmium in dry vegetables at 0.5 part per million (ppm). M. Melgar et al. measured the cadmium levels in a random sample of the edible mushroom Boletus pinicola and published the results in the paper “Influence of Some Factors in Toxicity and Accumulation of Cd from Edible Wild Macrofungi in NW Spain” (Journal of Environmental Science and Health, Vol. B33(4), pp. 439–455). A hypothesis test is to be performed to decide whether the mean cadmium level in Boletus pinicola mushrooms is greater than the government’s recommended limit. Hypothesis tests are proposed. For each hypothesis test,a. determine the null hypothesis.b. determine the alternative hypothesis.c. classify the hypothesis test as two tailed, left tailed, or right tailed.arrow_forwardThe 5-year incidence of cardiovascular disease (CVD) in relation to smoking status was determined in a population sample of 1000 men, 18 years and older. At baseline, 30% of the men were classified as being current smokers and 70% as being non-smokers. At the end of the follow-up, 60 CVD events had occurred among the smokers and 70 events among the non-smokers. Construct a 2 x 2 table based on the data providedarrow_forward
 Glencoe Algebra 1, Student Edition, 9780079039897...AlgebraISBN:9780079039897Author:CarterPublisher:McGraw Hill
 Big Ideas Math A Bridge To Success Algebra 1: Stu...AlgebraISBN:9781680331141Author:HOUGHTON MIFFLIN HARCOURTPublisher:Houghton Mifflin Harcourt