
Videos
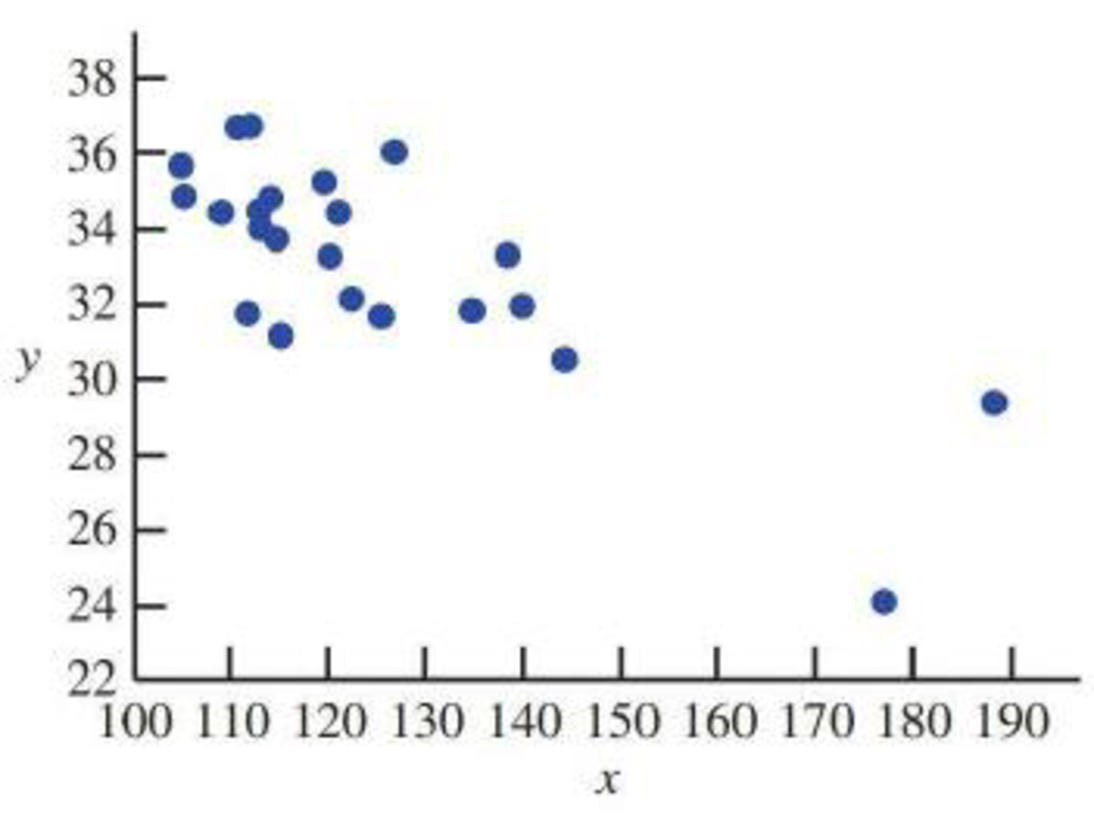
One factor in the development of tennis elbow, a malady that strikes fear into the hearts of all serious players of that sport, is the impact-induced vibration of the racket-and-arm system at ball contact. It is well known that the likelihood of getting tennis elbow depends on various properties of the racket used. Consider the accompanying

Trending nowThis is a popular solution!

Chapter 3 Solutions
Introduction To Statistics And Data Analysis
Additional Math Textbook Solutions
Essentials of Statistics, Books a la Carte Edition (5th Edition)
Research Methods for the Behavioral Sciences (MindTap Course List)
Elementary Statistics: A Step By Step Approach
Essentials of Statistics (6th Edition)
Intro Stats, Books a la Carte Edition (5th Edition)
Elementary Statistics (Text Only)


- Repeat Example 5 when microphone A receives the sound 4 seconds before microphone B.arrow_forwardA manufacturer claims that the tensile strength of a certain composite (in MPa) has the lognormal distribution with μ = 5 and σ = 0.5. Let X be the strength of a randomly sampled specimen of this composite. a) If the claim is true, what is P(X < 20)? b) Based on the answer to part (a), if the claim is true, would a strength of 20 MPa be unusually small? c) If you observed a tensile strength of 20 MPa, would this be convincing evidence that the claim is false? Explain. d) If the claim is true, what is P(X < 130)? e) Based on the answer to part (d), if the claim is true, would a strength of 130 MPa be unusually small? f) If you observed a tensile strength of 130 MPa, would this be convincing evidence that the claim is false? Explain.arrow_forwarda. What is the probability that the lifetime X of the first component exceeds 3? b. What are the marginal pdf's of X and Y? Are the two lifetimes independent? x. What is the probability that the lifetime of at least one component exceeds 3?arrow_forward
- Compare the two separate scatterplots. In particular, how do the associtation compare between women with pets vs. women without pets? Does one group have more variation in systolic blood pressure than the other? If so, for which group? Does systolic blood pressure seem higher for common ages between the two groups? If so, for which group?arrow_forwardThe article in the ASCE Journal of Energy Engineering (1999, Vol. 125, pp.59-75) describes a study of the thermal inertia properties of autoclaved aerated concrete used as a building material. Five samples of the material were tested in a structure, and the average interior temperatures (°C) reported were as follows: 23.01, 22.22, 22.04, 22.62, and 22.59. Test that the average interior temperature is equal to 22.5°C using alpha (a) = 0.05. This problem is a test on what population parameter? What is the null and alternative hypothesis? What are the Significance level and type of test? What standardized test statistic will be used? What is the standard test statistic? What is the Statistical Decision? What is the statistical decision in the statement form?arrow_forwardIn a typical multiple linear regression model where x1 and x2 are non-random regressors, the expected value of the response variable y given x1 and x2 is denoted by E(y | 2,, X2). Build a multiple linear regression model for E (y | *,, *2) such that the value of E(y | x1, X2) may change as the value of x2 changes but the change in the value of E(y | X1, X2) may differ in the value of x1 . How can such a potential difference be tested and estimated statistically?arrow_forward
- Compute the forecasted values for Yt for July and August in 2020 by using the modelsstated in (c) and (d)arrow_forwardResearchers interested in lead exposure due to car exhaust sampled the blood of 52 police officers subjected to constant inhalation of automobile exhaust fumes while working traffic enforcement in a primarily urban environment. The blood samples of these officers had an average lead concentration of 124.32 µg/l and a SD of 37.74 µg/l; a previous study of individuals from a nearby suburb, with no history of exposure, found an average blood level concentration of 35 µg/l. Based on your preceding result, without performing a calculation, would a 99% confidence interval for the average blood concentration level of police officers contain 35 µg/l? Based on your preceding result, without performing a calculation, would a 99% confidence interval for this difference contain 0? Explain why or why not.arrow_forwardThe article “Withdrawal Strength of Threaded Nails” (D. Rammer, S. Winistorfer, and D. Bender, Journal of Structural Engineering 2001:442–449) describes an experiment comparing the ultimate withdrawal strengths (in N/mm) for several types of nails. For an annularly threaded nail with shank diameter 3.76 mm driven into spruce-pine-fir lumber, the ultimate withdrawal strength was modeled as lognormal with μ = 3.82 and σ = 0.219. For a helically threaded nail under the same conditions, the strength was modeled as lognormal with μ = 3.47 and σ = 0.272. a) What is the mean withdrawal strength for annularly threaded nails? b) What is the mean withdrawal strength for helically threaded nails? c) For which type of nail is it more probable that the withdrawal strength will be greater than 50 N/mm? d) What is the probability that a helically threaded nail will have a greater withdrawal strength than the median for annularly threaded nails? e) An experiment is performed in which withdrawal…arrow_forward
- If the value of Cronbach’s alpha is 0.07, it means ___________; a. Research instrument is not reliable b. Research instrument is internally consistent c. Data is reliable d. Data is internally consistentarrow_forwardFor some genetic mutations, it is thought that the frequency of the mutant gene in men increases linearly with age. If m1 is the frequency at age t1, and m2 is the frequency at age t2, then the yearly rate of increase is estimated by r = (m2 − m1)/(t2 − t1). In a polymerase chain reaction assay, the frequency in 20-year-old men was estimated to be 17.7 ± 1.7 per μgDNA, and the frequency in 40-year-old men was estimated to be 35.9 ± 5.8 per μg DNA. Assume that age is measured with negligible uncertainty.a) Estimate the yearly rate of increase, and find the uncertainty in the estimate.b) Find the relative uncertainty in the estimated rate of increase.arrow_forwardNote- bolded quiz have already answered A possible important environmental determinant of lung function in children is the amount of cigarette smoking in the home. Suppose this question is studied by selecting two groups: Group 1 consists of 23 nonsmoking children 5-9 years of age, both of whose parents smoke, who have a mean forced expiratory volume (FEV) of 2.1 L and a standard deviation of 0.7 L; group 2 consists of 20 nonsmoking children of comparable age, neither of whose parents smoke, who have a mean FEV of 2.3 L and a standard deviation of 0.4 L.*8.31 What are the appropriate null and alternative hypotheses to compare the means of the two groups? *8.32 What is the appropriate test procedure for the hypotheses in Problem 8.31? *8.33 Carry out the test in Problem 8.32 using the criticalvalue method. *8.34 Provide a 95% CI for the true mean difference in FEV between 5- to 9-year-old children whose parents smoke and comparable children whose parents do not smoke. *8.35 Assuming…arrow_forward
 Glencoe Algebra 1, Student Edition, 9780079039897...AlgebraISBN:9780079039897Author:CarterPublisher:McGraw Hill
 Trigonometry (MindTap Course List)TrigonometryISBN:9781337278461Author:Ron LarsonPublisher:Cengage Learning