
Concept explainers
Videos
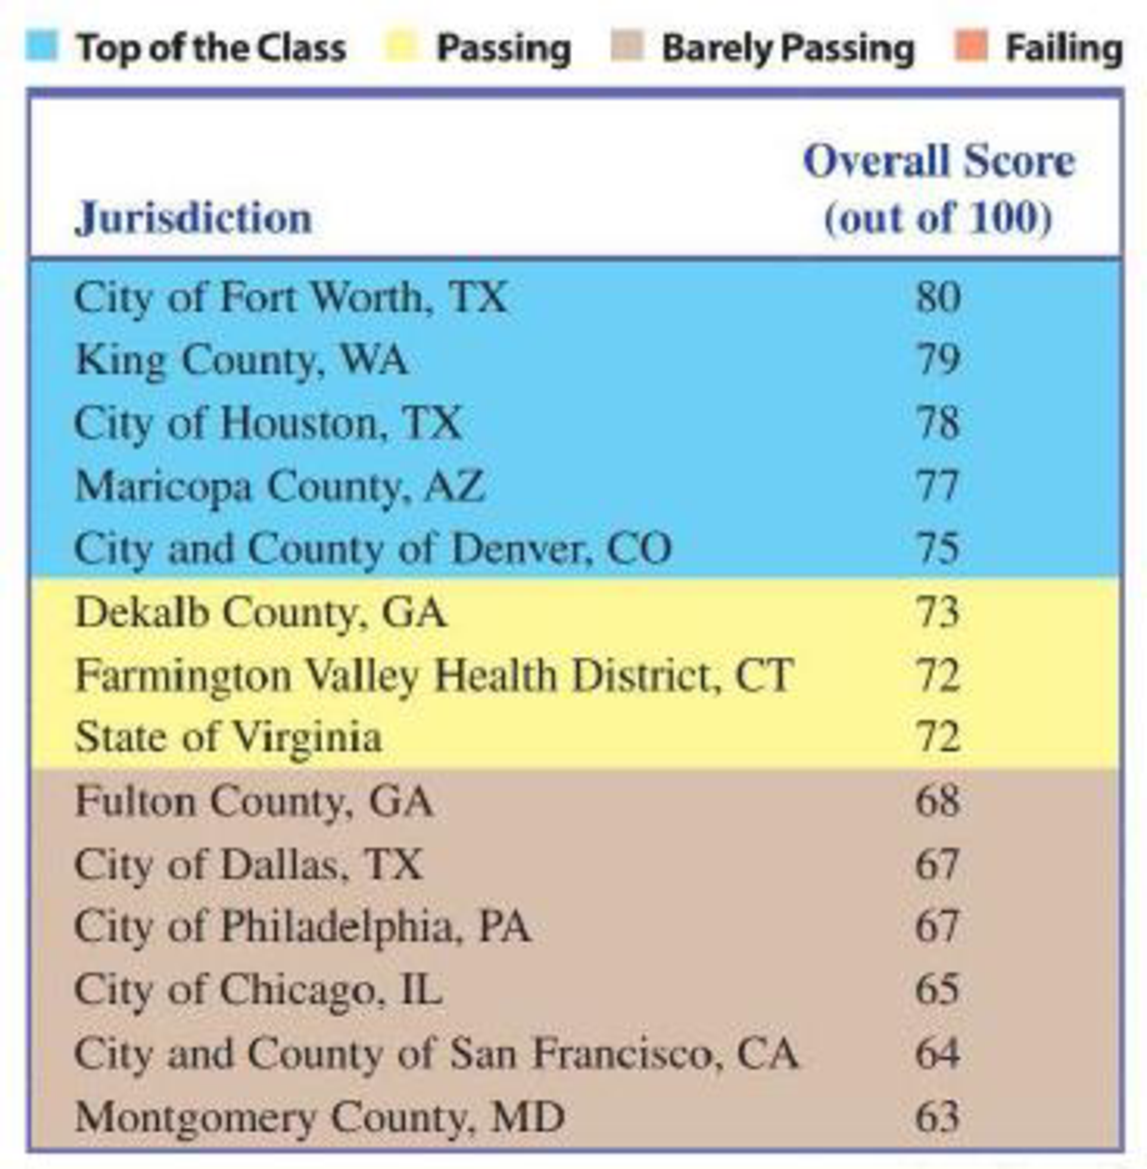
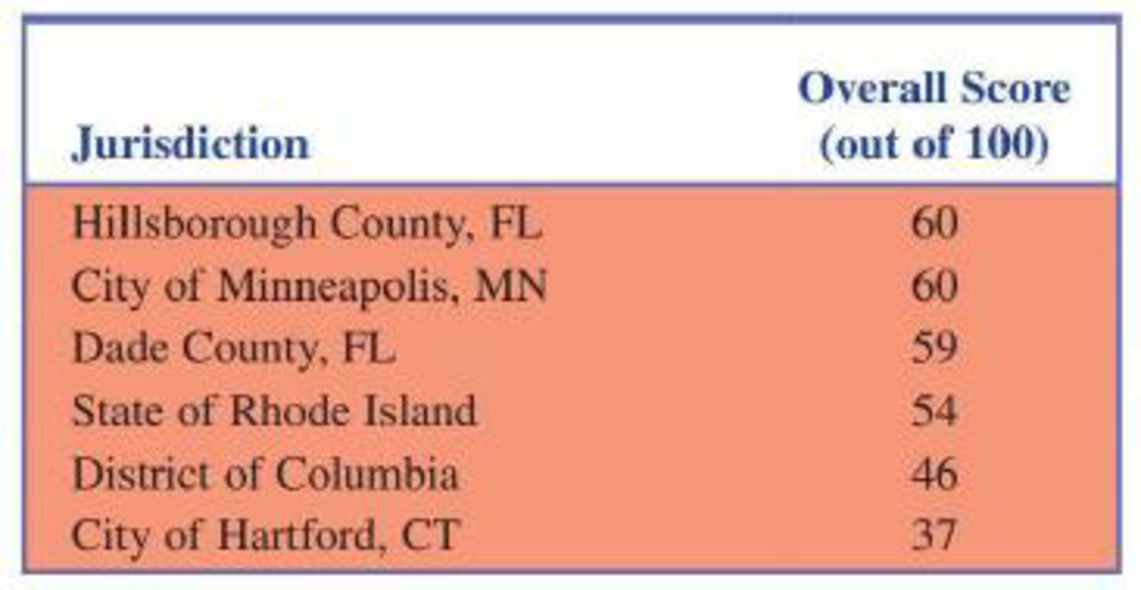
Using the data given in the previous exercise, construct a dotplot of the overall score data. Based on the dotplot, suggest an alternate assignment of grades (top of class, passing, etc.) to the 20 school districts. Explain the reasoning you used to make your assignment. (Hint: Dotplots were covered in Section 1.4.)
3.6 • The Center for Science in the Public Interest evaluated school cafeterias in 20 school districts across the United States. Each district was assigned a numerical score on the basis of rigor of food codes, frequency of food safety inspections, access to inspection information, and the results of cafeteria inspections. Based on the score assigned, each district was also assigned one of four grades.
The scores and grades are summarized in the accompanying table, which appears in the report “Making the Grade: An Analysis of Food Safety in School Cafeterias”(cspi.us/new/

Trending nowThis is a popular solution!

Chapter 3 Solutions
Introduction To Statistics And Data Analysis
Additional Math Textbook Solutions
Introduction to Statistical Quality Control
Developmental Mathematics (9th Edition)
Fundamentals of Statistics (5th Edition)
Business Analytics
Elementary Statistics
Elementary Statistics Using Excel (6th Edition)


 Big Ideas Math A Bridge To Success Algebra 1: Stu...AlgebraISBN:9781680331141Author:HOUGHTON MIFFLIN HARCOURTPublisher:Houghton Mifflin Harcourt
 Glencoe Algebra 1, Student Edition, 9780079039897...AlgebraISBN:9780079039897Author:CarterPublisher:McGraw Hill
 Holt Mcdougal Larson Pre-algebra: Student Edition...AlgebraISBN:9780547587776Author:HOLT MCDOUGALPublisher:HOLT MCDOUGAL
 Algebra: Structure And Method, Book 1AlgebraISBN:9780395977224Author:Richard G. Brown, Mary P. Dolciani, Robert H. Sorgenfrey, William L. ColePublisher:McDougal Littell