
Concept explainers
Videos
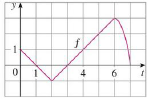
Let
(a) Evaluate g(x) for x = 0, 1, 2, 3, 4, 5, and 6.
(b) Estimate g(7).
(c) Where does g have a maximum value? Where does it have a minimum value?
(d) Sketch a rough graph of g.
(a)
The value of
Answer to Problem 2E
The value of
The value of
The value of
The value of
The value of
The value of
The value of
Explanation of Solution
Given information:
The equation is
Calculation:
Show the integral function as below:
Here,
Determine
Substitute 0 for x in Equation (1).
Therefore,
Draw the graph for the calculation of
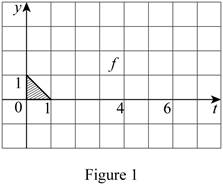
Determine
Substitute 1 for x in Equation (1).
Refer to Figure (1).
The area of the shaded triangle is the function of t with limits 0 to 1.
Modify Equation (2).
Substitute 1 for b and 1 for h.
Therefore,
Draw the graph for the calculation of
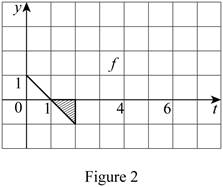
Determine
Substitute 2 for x in Equation (1).
Refer to Figure (2).
The area of the shaded triangle is the function of t with limits 1 to 2.
Substitute
Substitute 1 for b and -1 for h.
Therefore,
Draw the graph for the calculation of
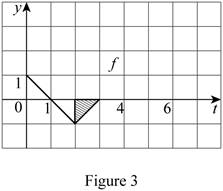
Determine
Substitute 3 for x in Equation (1).
Refer to Figure 3.
The area of the shaded triangle is the function of t with limits 2 to 3.
Substitute
Substitute 1 for b and -1 for h.
Therefore,
Draw the graph for the calculation of
Determine
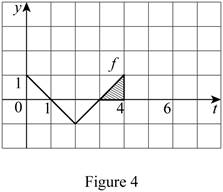
Substitute 4 for x in Equation (1).
Refer to Figure 4.
The area of the shaded triangle is the function of t with limits 3 to 4.
Substitute
Substitute 1 for b and 1 for h.
Therefore,
Draw the graph for the calculation of
Determine
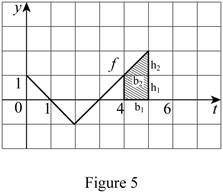
Substitute 5 for x in Equation (1).
Refer to Figure 5.
The area of the shaded portion is the function of t with limits 4 to 5.
Substitute
Substitute 1 for
Therefore, the
Draw the graph for the calculation of
Determine
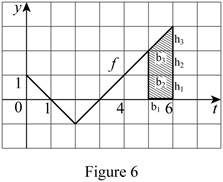
Substitute 6 for x in Equation (1).
Refer to Figure 6.
The area of the shaded portion is the function of t with limits 5 to 6.
Substitute 1.5 for
Substitute 1 for
Therefore,
(b)
The value of
Answer to Problem 2E
The value of
Explanation of Solution
Given information:
The equation is
Calculation:
Draw the graph for the calculation of
Determine
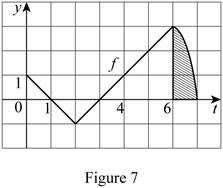
Substitute 7 for x in Equation (1).
Refer to Figure 7.
The area of the shaded portion is the function of t with limits 6 to 7; it is bounded by a curved shape. Hence, take the approximate value from the graph
Take the approximate area of the shaded portion as 2.2
Substitute 4 for
Therefore,
(c)
The maximum and minimum value of g.
Answer to Problem 2E
The minimum value of g lies at
Explanation of Solution
Given information:
The equation is
Calculation:
From the calculation in Part (A),
The minimum value of function of g is
The maximum value of function of g is 6.2 at
Therefore, the minimum value of g lies at
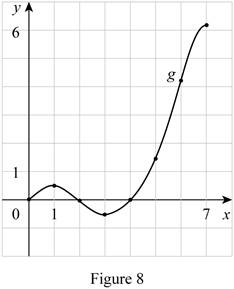
(d)
To Sketch: The rough graph of g.
Explanation of Solution
Plot the graph for function f using the calculated values of 0,
Draw the graph for the function of f as in Figure (8).
Chapter 5 Solutions
Single Variable Calculus: Concepts and Contexts, Enhanced Edition
Additional Math Textbook Solutions
Calculus: Single And Multivariable
Precalculus (10th Edition)
University Calculus: Early Transcendentals (3rd Edition)
Advanced Mathematical Concepts: Precalculus with Applications, Student Edition
University Calculus: Early Transcendentals, Single Variable (3rd Edition)
Calculus: Early Transcendentals (2nd Edition)


 Calculus: Early TranscendentalsCalculusISBN:9781285741550Author:James StewartPublisher:Cengage Learning
 Thomas' Calculus (14th Edition)CalculusISBN:9780134438986Author:Joel R. Hass, Christopher E. Heil, Maurice D. WeirPublisher:PEARSON
 Calculus: Early Transcendentals (3rd Edition)CalculusISBN:9780134763644Author:William L. Briggs, Lyle Cochran, Bernard Gillett, Eric SchulzPublisher:PEARSON
 Calculus: Early TranscendentalsCalculusISBN:9781319050740Author:Jon Rogawski, Colin Adams, Robert FranzosaPublisher:W. H. Freeman
 Calculus: Early Transcendental FunctionsCalculusISBN:9781337552516Author:Ron Larson, Bruce H. EdwardsPublisher:Cengage Learning