
Videos
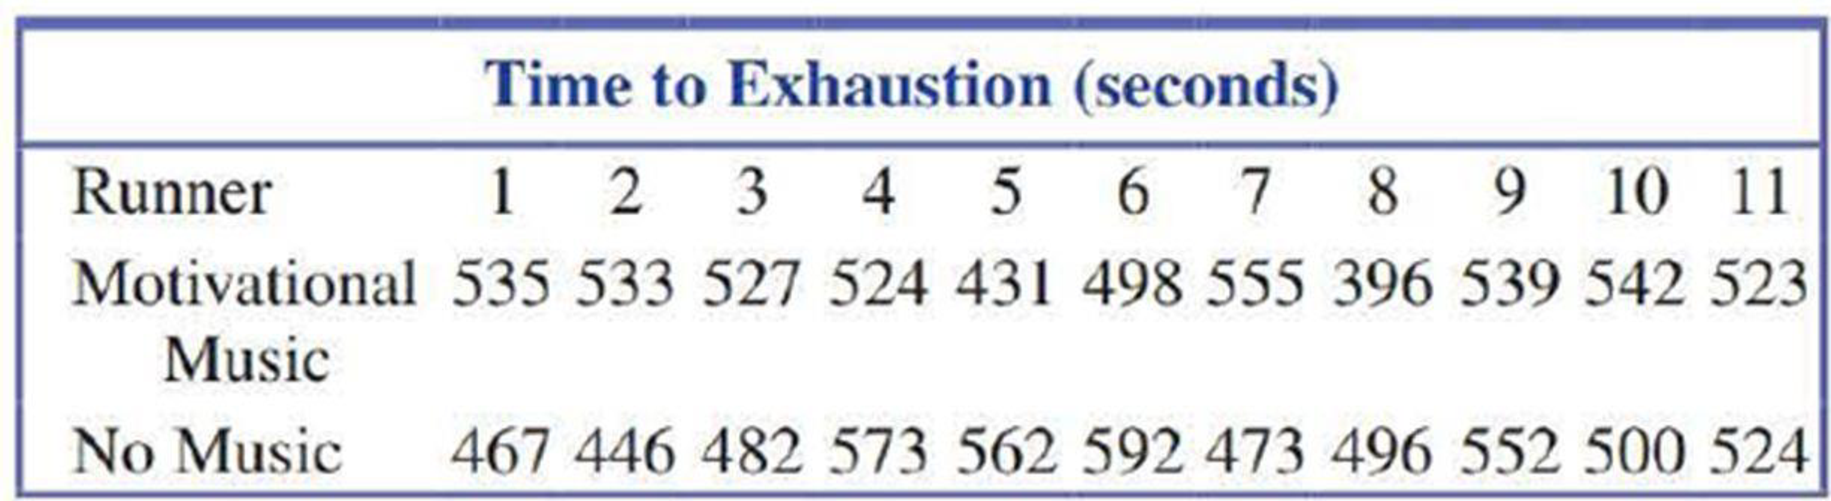
Many runners believe that listening to music while running enhances their performance. The authors of the paper “Effects of Synchronous Music on Treadmill Running Among Elite Triathletes” (Journal of Science and Medicine in Sport [2012]: 52–57) wondered if this was true for experienced runners. They recorded time to exhaustion for 11 triathletes while running on a treadmill at a speed determined to be near their peak running velocity. The time to exhaustion was recorded for each participant on two different days. On one day, each participant ran while listening to music that the runner selected as motivational. On a different day, each participant ran with no music playing.
You can assume that it is reasonable to regard these 11 tri athletes as representative of the population of experienced triathletes. Only summary quantities were given in the paper, but the data in the table below are consistent with the means and standard deviations given in the paper. Do the data provide convincing evidence that the

Trending nowThis is a popular solution!

Chapter 11 Solutions
Introduction To Statistics And Data Analysis


- In a study attempting to replicate findings by Stephens, Atkins, & Kingston (2009), each participant was asked to plunge a hand into the icy water and keep it there as long as the pain would allow. In one condition, the participants repeated their favorite curse words while their hands were in the water. In the other condition, they repeated neutral words. The original research showed that, in addition to lowering the participants’ perception of pain, swearing also increased the amount of time they were able to tolerate the pain. Data similar to the results obtained in the study are shown in the following table: _____________Amount of Time (in Seconds)_ Participant Swear Words Neutral Words 1 94 59 2 70 61 3 52 47 4…arrow_forwardIf a newborn lab rat receives a hormone and its weight (in ounces) is converted into a z score that is greater than +2.00, what would the researcher most likely conclude about whether or not the hormone had an effect on the rat's weight?arrow_forwardThe article “Withdrawal Strength of Threaded Nails” (D. Rammer, S. Winistorfer, and D. Bender, Journal of Structural Engineering 2001:442–449) describes an experiment comparing the ultimate withdrawal strengths (in N/mm) for several types of nails. For an annularly threaded nail with shank diameter 3.76 mm driven into spruce-pine-fir lumber, the ultimate withdrawal strength was modeled as lognormal with μ = 3.82 and σ = 0.219. For a helically threaded nail under the same conditions, the strength was modeled as lognormal with μ = 3.47 and σ = 0.272. a) What is the mean withdrawal strength for annularly threaded nails? b) What is the mean withdrawal strength for helically threaded nails? c) For which type of nail is it more probable that the withdrawal strength will be greater than 50 N/mm? d) What is the probability that a helically threaded nail will have a greater withdrawal strength than the median for annularly threaded nails? e) An experiment is performed in which withdrawal…arrow_forward
- At any age, about 20% of American adults participate in physical conditioning activities at least twice a week. However, these activities change as people get older, and occasionally participants cease to be older as they age. In a local survey of n = 100 adults over 40 years of age, a total of 15 people indicated that they participated in these activities at least twice a week. Does this data indicate that the percentage of participation for adults over 40 years of age is considerably less than the 20% figure? Find the p-value and use it to draw the appropriate conclusions.arrow_forwardA poll of 700 frequent and occasional fliers found that 450 respondents favored a ban on cellphones in flight, even if technology permits it. At α = .05, can we conclude that morethan half the sampled population supports a ban?arrow_forwardBased on information from a previous study, r1 = 38 people out of a random sample of n1 = 105 adult Americans who did not attend college believe in extraterrestrials. However, out of a random sample of n2 = 105 adult Americans who did attend college, r2 = 49 claim that they believe in extraterrestrials. Does this indicate that the proportion of people who attended college and who believe in extraterrestrials is higher than the proportion who did not attend college? Use α = 0.01. 1. What is the value of the sample test statistic? (Test the difference p1 − p2. Do not use rounded values. Round your final answer to two decimal places.) 2. Find (or estimate) the P-value. (Round your answer to four decimal places.)arrow_forward
- Based on information from a previous study, r1 = 34 people out of a random sample of n1 = 105 adult Americans who did not attend college believe in extraterrestrials. However, out of a random sample of n2 = 105 adult Americans who did attend college, r2 = 50 claim that they believe in extraterrestrials. Does this indicate that the proportion of people who attended college and who believe in extraterrestrials is higher than the proportion who did not attend college? Use ? = 0.01. (a) What is the level of significance?State the null and alternate hypotheses. H0: p1 = p2; H1: p1 ≠ p2H0: p1 < p2; H1: p1 = p2 H0: p1 = p2; H1: p1 < p2H0: p1 = p2; H1: p1 > p2 (b) What sampling distribution will you use? What assumptions are you making? The Student's t. The number of trials is sufficiently large.The standard normal. We assume the population distributions are approximately normal. The standard normal. The number of trials is sufficiently large.The Student's t. We assume the…arrow_forwardBased on information from a previous study, r1 = 39 people out of a random sample of n1 = 105 adult Americans who did not attend college believe in extraterrestrials. However, out of a random sample of n2 = 105 adult Americans who did attend college, r2 = 50 claim that they believe in extraterrestrials. Does this indicate that the proportion of people who attended college and who believe in extraterrestrials is higher than the proportion who did not attend college? Use ? = 0.01. What is the value of the sample test statistic? (Test the difference p1 − p2. Do not use rounded values. Round your final answer to two decimal places.)(c) Find (or estimate) the P-value. (Round your answer to four decimal places.)arrow_forwardThe researchers reported:" A 2x2 ANOVA revealed, first of all, a main effect for depletion, indicating that depleted individuals generated less ideas (M = 9.40, SD = 5.64) than non-depleted individuals (M = 12.44, SD = 7.34), F (1, 108) = 6.03, p = .016, n2 = .05. This effect was qualified by the expected interaction with [perseverance], F (1,108) = 4.52, p = .036, n2 = .05". What size are the effects for the main effect of depletion and for the interaction between depletion and perseverance, according to Cohen's conventions? a. These are small- to -medium effects b. These are non existent effects c. These are large effects d. We are unable to tell from from the n2 / r2 statisticsarrow_forward
 Holt Mcdougal Larson Pre-algebra: Student Edition...AlgebraISBN:9780547587776Author:HOLT MCDOUGALPublisher:HOLT MCDOUGAL
 Glencoe Algebra 1, Student Edition, 9780079039897...AlgebraISBN:9780079039897Author:CarterPublisher:McGraw Hill