
Introduction To Statistics And Data Analysis
6th Edition
ISBN: 9781337793612
Author: PECK, Roxy.
Publisher: Cengage Learning,
expand_more
expand_more
format_list_bulleted
Concept explainers
Videos
Textbook Question
Chapter 13.1, Problem 10E
Hormone replacement therapy (HRT) is thought to increase the risk of breast cancer. The accompanying data on
x = Percent of women using HRT
and
y = Breast cancer incidence (cases per 100,000 women) for a region in Germany for 5 years appeared in the paper “Decline in Breast Cancer Incidence after Decrease in Utilisation of Hormone Replacement Therapy” (Epidemiology [2008]: 427–430). The authors of the paper used a simple linear regression model to describe the relationship between HRT use and breast cancer incidence.
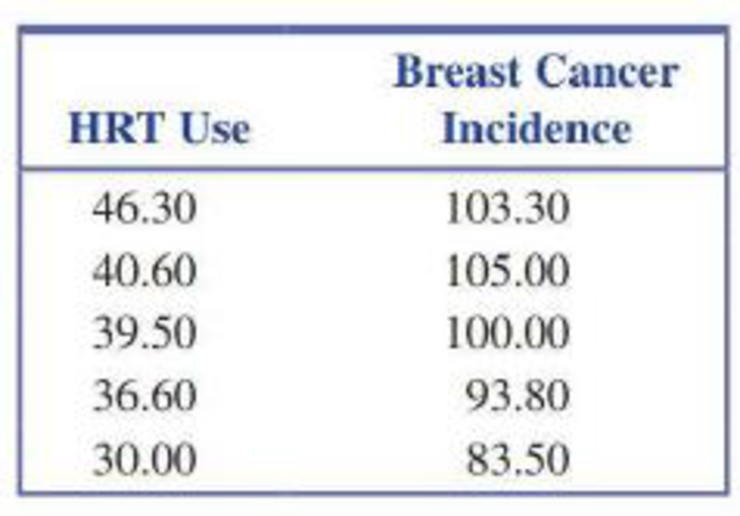
- a. What is the equation of the estimated regression line?
- b. What is the estimated average change in breast cancer incidence associated with a 1 percentage point increase in HRT use?
- c. What breast cancer incidence would be predicted in a year when HRT use was 40%?
- d. Should this regression model be used to predict breast cancer incidence for a year when HRT use was 20%? Explain.
Expert Solution & Answer

Trending nowThis is a popular solution!

Students have asked these similar questions
Life insurance companies are keenly interested in predicting how long their customers are likely to live, because this will determine their premiums and ultimately their profitability. An Australian life insurance company is interested in the relationship, if any, between the age at death of their male customers and that of the customer’s father. Data are collected on a random sample of 100 of their male customers who have recently died. The customer’s age at death was plotted against that of their father and a linear regression model applied. Relevant output is shown below.
Say how you know from the output that there actually is a significant linear relationship between a male customer’s age at death and his father’s age at death.
State the value of the coefficient of Father’s Age (Death) and interpret this value in the context of the problem at hand.State the value of the coefficient of determination in the model and interpret this value in the context of the situation.
Life insurance companies are keenly interested in predicting how long their customers are likely to live, because this will determine their premiums and ultimately their profitability. An Australian life insurance company is interested in the relationship, if any, between the age at death of their male customers and that of the customer’s father. Data are collected on a random sample of 100 of their male customers who have recently died. The customer’s age at death was plotted against that of their father and a linear regression model applied. Relevant output is shown below
Examine both the scatterplot and the correlation matrix provided above. Comment on the apparent relationship between the customer’s age at death and their father’s age at death in the plot. Explain how the information in the correlation matrix supports your conclusion
The owner of Original Italian Pizza restaurant chain wants to understand which variable most strongly influences the sales of his specialty deep-dish pizza. He has gathered data on the monthly sales of deep-dish pizzas at his restaurants and observations on other potentially relevant variables for each of several outlets in central Indiana. These data are provided in the file P10_04.xlsx. Estimate a simple linear regression equation between the quantity sold (Y) and each of the following candidates for the best explanatory variable: average price of deep-dish pizzas (X1), monthly advertising expenditures (X2), and disposable income per household in the areas surrounding the outlets (X3). Round your answers for intercept coefficients to the nearest whole number and slope coefficients to two decimal places, if necessary. If your answer is negative number, enter "minus" sign.
Chapter 13 Solutions
Introduction To Statistics And Data Analysis
Ch. 13.1 - Let x be the size of a house (in square feet) and...Ch. 13.1 - Consider the variables and population regression...Ch. 13.1 - The flow rate in a device used for air quality...Ch. 13.1 - The paper Predicting Yolk Height, Yolk Width,...Ch. 13.1 - A sample of small cars was selected, and the...Ch. 13.1 - Prob. 6ECh. 13.1 - Suppose that a simple linear regression model is...Ch. 13.1 - a. Explain the difference between the line y x...Ch. 13.1 - Prob. 9ECh. 13.1 - Hormone replacement therapy (HRT) is thought to...
Ch. 13.1 - Consider the data and estimated regression line...Ch. 13.1 - A simple linear regression model was used to...Ch. 13.1 - Consider the accompanying data on x = Advertising...Ch. 13.2 - What is the difference between and b? What is the...Ch. 13.2 - The largest commercial fishing enterprise in the...Ch. 13.2 - Prob. 16ECh. 13.2 - Prob. 17ECh. 13.2 - Prob. 18ECh. 13.2 - An experiment to study the relationship between x...Ch. 13.2 - The paper The Effects of Split Keyboard Geometry...Ch. 13.2 - The authors of the paper Decreased Brain Volume in...Ch. 13.2 - Do taller adults make more money? The authors of...Ch. 13.2 - Researchers studying pleasant touch sensations...Ch. 13.2 - Prob. 24ECh. 13.2 - Acrylamide is a chemical that is sometimes found...Ch. 13.2 - Prob. 26ECh. 13.2 - Exercise 13.18 described a regression analysis...Ch. 13.2 - Consider the accompanying data on x = Research and...Ch. 13.2 - Prob. 29ECh. 13.2 - In anthropological studies, an important...Ch. 13.3 - The graphs accompanying this exercise are based on...Ch. 13.3 - Prob. 32ECh. 13.3 - Prob. 33ECh. 13.3 - The article Vital Dimensions in Volume Perception:...Ch. 13.3 - Prob. 35ECh. 13.3 - An investigation of the relationship between x =...Ch. 13.4 - Prob. 37ECh. 13.4 - Prob. 38ECh. 13.4 - In Exercise 13.19, we considered a regression of y...Ch. 13.4 - Prob. 40ECh. 13.4 - A subset of data read from a graph that appeared...Ch. 13.4 - Prob. 42ECh. 13.4 - Prob. 43ECh. 13.4 - The article first introduced in Exercise 13.34 of...Ch. 13.4 - The shelf life of packaged food depends on many...Ch. 13.4 - For the cereal data of the previous exercise, the...Ch. 13.4 - The article Performance Test Conducted for a Gas...Ch. 13.5 - Prob. 48ECh. 13.5 - Prob. 49ECh. 13.5 - A sample of n = 353 college faculty members was...Ch. 13.5 - Prob. 51ECh. 13.5 - Prob. 52ECh. 13.5 - The accompanying summary quantities for x =...Ch. 13.5 - Prob. 54ECh. 13.5 - Prob. 55ECh. 13.6 - Prob. 56ECh. 13 - Prob. 1CRECh. 13 - Prob. 2CRECh. 13 - Prob. 3CRECh. 13 - Prob. 4CRECh. 13 - Prob. 5CRECh. 13 - The accompanying graphical display is similar to...Ch. 13 - Prob. 7CRECh. 13 - Prob. 8CRECh. 13 - Consider the following data on y = Number of songs...Ch. 13 - Many people take ginkgo supplements advertised to...Ch. 13 - Prob. 11CRECh. 13 - Prob. 12CRECh. 13 - Prob. 13CRECh. 13 - Prob. 14CRECh. 13 - The discharge of industrial wastewater into rivers...Ch. 13 - Many people take ginkgo supplements advertised to...Ch. 13 - It is hypothesized that when homing pigeons are...Ch. 13 - Prob. 18CRECh. 13 - Prob. 57CRCh. 13 - Prob. 58CRCh. 13 - Prob. 59CRCh. 13 - The article Photocharge Effects in Dye Sensitized...Ch. 13 - Prob. 61CRCh. 13 - Prob. 62CRCh. 13 - Prob. 63CRCh. 13 - Prob. 64CRCh. 13 - Prob. 65CRCh. 13 - The article Improving Fermentation Productivity...Ch. 13 - Prob. 67CRCh. 13 - Prob. 68CRCh. 13 - Prob. 69CR
Knowledge Booster


Learn more about
Need a deep-dive on the concept behind this application? Look no further. Learn more about this topic, statistics and related others by exploring similar questions and additional content below.Similar questions
- The Update to the Task Force Report on Blood Pressure Control in Children [12] reported the observed 90th per-centile of SBP in single years of age from age 1 to 17 based on prior studies. The data for boys of average height are given in Table 11.18. Suppose we seek a more efficient way to display the data and choose linear regression to accomplish this task. age sbp 1 99 2 102 3 105 4 107 5 108 6 110 7 111 8 112 9 114 10 115 11 117 12 120 13 122 14 125 15 127 16 130 17 132 Do you think the linear regression provides a good fit to the data? Why or why not? Use residual analysis to justify your answer. Am I supposed to run a residual plot and QQ-plot for this question?arrow_forwardThe monthly premium quoted by an insurance company for a critical illness policy was collected from a sample of 6 adult male smokers at different age. The data for the sample are shown: Age 28 25 50 39 47 31 Premium ($) 75 40 175 125 250 105 Using Age to predict premium, the Linear Regression equation is given by: ŷ =6.556X−112 and r2=0.813y^=6.556X−112 and r2=0.813 a. Identify the independent and Dependent variables. Dependent: Age Premium Independent: Age Premium b. Determine the slope. Slope = Slope = Round to 3 decimal places c. Determine |r||r| . |r|=|r|= Round to 3 decimal places d. Interpret rr : and e. Determine critical r value at 5% significance level and determine if there is a significant linear correlation exists. |r| critical=|r| critical= Round to 3 decimal places Linear Correlation:Linear Correlation: Significant Not Significant f. Predict the monthly premium for a 40 years old adult male smoker.…arrow_forwardA fast-food chain decided to carry out an experiment to assess the influence of advertising expenditure on sales. Different relative changes in advertising expenditure, compared to the previous year, were made in eight regions of the country, and resulting changes in sales levels were observed the accompanying table shows the results. Increase in advertising expenditure (%) 0 5 15 20 25 30 35 40 Increase in sales (%) 5 10 18 25 35 50 60 65 Determine the value of regressions coefficients and write down the simple linear regression model.arrow_forward
- A mail-order business selling personal computer supplies, software and hardware maintains a centralized warehouse. Management is currently examining the process of distribution from the warehouse and wants to study the factors that affect the warehouse distribution costs. Data collected over 24 random months contain the warehouse’s distribution cost (in thousands of Rands), the sales (in thousands of Rands) and the number of orders received. A multiple linear regression model was fitted to the data by using Stat1.2. Use the output to answer the questions that follow by typing only the letter of the correct option in the answer boxes. Variablesy: Warehouse Distribution Costx1: Salesx2: Number of Orders Model Fitting StatisticsR2 = 0.8504Adj R2: ? Regression Coefficients Beta Parameter Standard b Parameter Standard Estimates…arrow_forwardThe issue of multicollinearity impacted the 'vadity and trustworthiness' of a regression model. demonstrate how this issue can be a problem by using an appropriate hypothetical and mathematical example.arrow_forwardThe systolic blood pressure dataset (in the third sheet of the spreadsheet linked above) contains the systolic blood pressure and age of 30 randomly selected patients in a medical facility. What is the equation for the least square regression line where the independent or predictor variable is age and the dependent or response variable is systolic blood pressure? Y=__________ X + ______________ Patient 7 is 67 years old and has a systolic blood pressure of 170 mm Hg. What is the residual? __________ mm Hg Is the actual value above, below, or on the line? What is the interpretation of the residual? (difference in actual &predicated bp, difference in age, the amount of systolic changes)arrow_forward
- Even though the disturbance term in the classical linear regression model is not normallydistributed, the ordinary least square estimators are still unbiased. Why?arrow_forwardIf a scatterplot is created in excel, and a line of regression is fit along with a derived functional form, what does it mean to describe and interpret them? What conclusions would be made about relationships between two recorded variables?arrow_forwardA medical researcher wishes to determine how the dosage (in milliliters) of an experimental drugaffects the heart rate (in beats per minute) of patients with an elevated heart rate. The data for asample of eight patients with an elevated heart rate are provided in the following table.Drug Dosage 0 5 10 20 25 30 40 50Heart Rate 135 124 106 89 85 72 68 62(a) Determine the linear regression model that will best predict a patient’s heart rate based on thedosage of the drug received. (b) How well does the linear regression model fit this sample data? (c) If a patient with an elevated heart rate is administered a 35 ml dose of this drug, predict theresulting heart rate of the patient.arrow_forward
- Is CEO compensation related to a company's performance? To test whether CEO compensation and a company's stock performance are related, a financial analyst collected data on 12 randomly selected, publicly traded companies. For each company, the analyst looked at two variables: the percent change in stock price over the past five years (which she denoted x ) and the percent change in CEO compensation over the past five years (which she denoted y ). For these 12 companies, the least-squares regression equation relating the two variables was =y+−0.1650.046x , and the standard error of the slope of this least-squares regression line was approximately 0.028 . Using her information, test for a significant linear relationship between these two variables by doing a hypothesis test regarding the population slope β1 . (Assume that the variable y follows a normal distribution for each value of x and that the other regression assumptions are satisfied.) Use the…arrow_forwardGiven a generic data set (x,y) with a linear regression. How do you determine if the y(dependent) will be less/greater than a certain value at a decided value of x?arrow_forwardThe table presents data on the taste test of 38 brands of pinot noir wine [data were first reported in an article by Kwan, Kowalski, and Skogenboe in the Journal Agricultural and Food Chemistry (1979, Vol. 27), the response variable is y = quality, and we want to find the "best" regression equation that relates quality to the other five parametersarrow_forward
arrow_back_ios
SEE MORE QUESTIONS
arrow_forward_ios
Recommended textbooks for you
 MATLAB: An Introduction with ApplicationsStatisticsISBN:9781119256830Author:Amos GilatPublisher:John Wiley & Sons Inc
 Probability and Statistics for Engineering and th...StatisticsISBN:9781305251809Author:Jay L. DevorePublisher:Cengage Learning
 Statistics for The Behavioral Sciences (MindTap C...StatisticsISBN:9781305504912Author:Frederick J Gravetter, Larry B. WallnauPublisher:Cengage Learning
 Elementary Statistics: Picturing the World (7th E...StatisticsISBN:9780134683416Author:Ron Larson, Betsy FarberPublisher:PEARSON
 The Basic Practice of StatisticsStatisticsISBN:9781319042578Author:David S. Moore, William I. Notz, Michael A. FlignerPublisher:W. H. Freeman
 Introduction to the Practice of StatisticsStatisticsISBN:9781319013387Author:David S. Moore, George P. McCabe, Bruce A. CraigPublisher:W. H. Freeman
MATLAB: An Introduction with Applications
Statistics
ISBN:9781119256830
Author:Amos Gilat
Publisher:John Wiley & Sons Inc
Probability and Statistics for Engineering and th...
Statistics
ISBN:9781305251809
Author:Jay L. Devore
Publisher:Cengage Learning
Statistics for The Behavioral Sciences (MindTap C...
Statistics
ISBN:9781305504912
Author:Frederick J Gravetter, Larry B. Wallnau
Publisher:Cengage Learning
Elementary Statistics: Picturing the World (7th E...
Statistics
ISBN:9780134683416
Author:Ron Larson, Betsy Farber
Publisher:PEARSON
The Basic Practice of Statistics
Statistics
ISBN:9781319042578
Author:David S. Moore, William I. Notz, Michael A. Fligner
Publisher:W. H. Freeman
Introduction to the Practice of Statistics
Statistics
ISBN:9781319013387
Author:David S. Moore, George P. McCabe, Bruce A. Craig
Publisher:W. H. Freeman
Correlation Vs Regression: Difference Between them with definition & Comparison Chart; Author: Key Differences;https://www.youtube.com/watch?v=Ou2QGSJVd0U;License: Standard YouTube License, CC-BY
Correlation and Regression: Concepts with Illustrative examples; Author: LEARN & APPLY : Lean and Six Sigma;https://www.youtube.com/watch?v=xTpHD5WLuoA;License: Standard YouTube License, CC-BY