
Concept explainers
Videos
In anthropological studies, an important characteristic of fossils is cranial capacity. Frequently skulls are at least partially decomposed, so it is necessary to use other characteristics to obtain information about cranial capacity. One measure that has been used is the length of the lambda-opisthion chord. The article “Vertesszollos and the Presapiens Theory” (American Journal of Physical Anthropology [1971]) reported the accompanying data for n = 7 Homo erectus fossils.
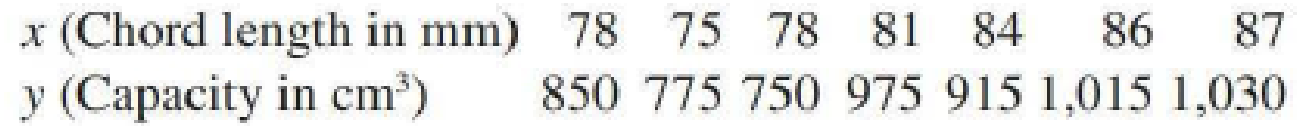
Suppose that from previous evidence, anthropologists had believed that for each 1-mm increase in chord length, cranial capacity would be expected to increase by 20 cm 3. Do the data given here strongly contradict prior belief?

Trending nowThis is a popular solution!

Chapter 13 Solutions
Introduction To Statistics And Data Analysis


- A large research project showed that in a sample of 750 adults, 60 of them experienced a midlife crisis . Use this data to test the claim that the percentage of adults who experienced midlife crisis is less than 10%. Use (alpha)= 0.05 .arrow_forwardNext, given a situation in which a research reports a large eta squared effect size (eta squared = .64), why might their reported t value be small and not statistically significant? What may be inference from such a situation? Indicate and provide examples of three of the factors that influence the size of t.arrow_forwardThe authors of the article "Adjuvant Radiotherapy and Chemotherapy in Node-Positive Premenopausal Women with Breast Cancer"† reported on the results of an experiment designed to compare treating cancer patients with chemotherapy only to treatment with a combination of chemotherapy and radiation. Of the 154 individuals who received the chemotherapy-only treatment, 76 survived at least 15 years, whereas 98 of the 164 patients who received the hybrid treatment survived at least that long. With p1 denoting the proportion of all such women who, when treated with just chemotherapy, survive at least 15 years and p2 denoting the analogous proportion for the hybrid treatment, p̂1 = (rounded to three decimal places) and p̂2 = (rounded to three decimal places). A confidence interval for the difference between proportions based on the traditional formula with a confidence level of approximately 99% is 0.494 − 0.598 ± (2.58) (0.494)(0.506) 154 + (0.598)(0.402) 164…arrow_forward
- The number of Muslims continues to grow throughout the world, and they are currently thesecond-largest religious group in the world. Knowing that this group has been the target of falsebeliefs about their religion, a researcher is interested in whether people who have moreinteractions with Muslim people are less likely to believe negative statements about Islam. To dothis, they surveyed a large sample of participants across Western Europe and asked themquestions about how frequently they interact with Muslim people as well as how much theyagreed with negative statements about Islam. What statistical test should be used to determine ifthere if how frequently survey participants interact with Muslim people predicts how likely theyare to agree with a negative statement about Islam? Assume parametric assumptions are met. A. Is this a relationship test or a difference test? Explain your rationale. B.arrow_forwardThe British Department of Transportation studied to see if people avoid driving on Friday the 13th. They did a traffic count on a Friday and then again on a Friday the 13th at the same two locations. The data for each location on the two different dates is in the table. Do the data show that on average fewer people drive on Friday the 13th? Test at the 5% level.Traffic Count Dates 6th 13th 1990, July 137669 135825 1990, July 129699 128891 1991, September 136898 138275 1991, September 138966 139940 1991, December 132021 129640 1991, December 119268 119214 1992, March 131938 131104 1992, March 123306 124760 1992, November 129499 129219 1992, November 138568 135934arrow_forwardSuppose a researcher is interested inthe effectiveness in a new childhood exercise program implemented in a SRS of schools across a particular county. In order to test the hypothesis that the new program decreases BMI (Kg/m2), the researcher takes a SRS of children from schools where the program is employed and a SRS from schools that do not employ the program and compares the results. Assume the following table represents the SRSs of students and their BMIs. Student intervention group BMI (kg/m2) Student control group BMI (kg/m2) A 18.6 A 21.6 B 18.2 B 18.9 C 19.5 C 19.4 D 18.9 D 22.6 E 24.1 F 23.6 A) Assuming that all the necessary conditions are met (normality, independence, etc.) carry out the appropriate statistical test to determine if the new exercise program is effective. Use an alpha level of 0.05. Do not assume equal variances.B) Construct a 95% confidence interval about your estimate for the average difference in BMI between the groups.arrow_forward
- 2. Consider a study where students are measured on whether they had an internship during their time at WKU (Y/N) and whether they had a job at graduation (Y/N). If we wanted to test whether having an internship was associated with having a job at graduation (i.e., internship holders were more likely to have jobs), why would the chi-square test be inappropriate for this hypothesis? How should we analyze our data?arrow_forwardThe UWI Open Campus has commissioned a study to determine how student will perform in ECON3080 based on the hours of studying each semester. Students are separated by gender and the results of the study are given below: Males Females Hours Studying ECON3080 Grade Hours Studying ECON3080 Grade 377 92 182 51 280 100 99 41 187 99 44 38 225 62 387 90 157 91 200 75 280 99 331 48 80 32 263 78 374 88 377 93 141 59 297 49 385 72 229 88 238 30 254 80 105 94 347 80 180 53 119 55 288 48 142 67 241 96 293 45 72 57 318 36 314 82 319 94 196 81 60 60 209 79 319 42 306 79 184 81 167 51 193 56 380 44 239 34 389 88 144 49 122 49 97 100 354 76 337 33 327 94 330 78 181 70 157 57 349 66 262 43 117 35…arrow_forwardA travel association says the daily lodging costs for a family in the United States is $132. You work for a tourist publication and want to test this claim. You randomly selected 10 U.S. families and find out how much each spent on lodging for one overnight trip. At alpha=0.02, can you reject the travel association's claim? (Adapted from the American Automobile Association) 164 137 142 155 119 104 74 204 148 181 Assume the population is normally distributed.arrow_forward
- Researchers interested in lead exposure due to car exhaust sampled the blood of 52 police officers subjected to constant inhalation of automobile exhaust fumes while working traffic enforcement in a primarily urban environment. The blood samples of these officers had an average lead concentration of 124.32 µg/l and an SD of 37.74 µg/l; a previous study of individuals from a nearby suburb, with no history of exposure, found an average blood level concentration of 35 µg/l. Write down the hypotheses that would be appropriate for testing if the police officers appear to have been exposed to a higher concentration of lead. Explicitly state and check all conditions necessary for inference on these data. Test the hypothesis that the downtown police officers have a higher lead exposure than the group in the previous study. Interpret your results in context. Based on your preceding result, without performing a calculation, would a 99% confidence interval for the average blood concentration…arrow_forwardA Texas Garden Center wants to store leftover packets of vegetable seeds from their spring sale to have for their fall sale, but the center is concerned that the seeds may not germinate at the same rate six months later. The manager randomly selects a packet of green bean seeds remaining from the spring sale and plants them as a test. Although the packet claims a germination rate of 92% of the seeds, only 171 of the 200 test seeds sprout. Is this evidence that the seeds have lost viability during their six months in storage?arrow_forwardAfter examining these data for all the jurisdictions, someone notes that certain areas have an unusually high “percent of 18-64 yr-olds with no high school diploma.” Based on this finding, this individual concludes that the high percentages are due to the rising population of immigrants in those areas. Further, the individual argues that any estimates of the associated “percent of low-income working families” in those areas should be recalculated after removing this sub-population from the data set, as they are causing the area to “look bad”. In addition to thinking critically, use the key rules about linear regression and extrapolation to write a statistically appropriate and socially responsible response to the individual’s conclusion and argument.arrow_forward
 MATLAB: An Introduction with ApplicationsStatisticsISBN:9781119256830Author:Amos GilatPublisher:John Wiley & Sons Inc
 Probability and Statistics for Engineering and th...StatisticsISBN:9781305251809Author:Jay L. DevorePublisher:Cengage Learning
 Statistics for The Behavioral Sciences (MindTap C...StatisticsISBN:9781305504912Author:Frederick J Gravetter, Larry B. WallnauPublisher:Cengage Learning
 Elementary Statistics: Picturing the World (7th E...StatisticsISBN:9780134683416Author:Ron Larson, Betsy FarberPublisher:PEARSON
 The Basic Practice of StatisticsStatisticsISBN:9781319042578Author:David S. Moore, William I. Notz, Michael A. FlignerPublisher:W. H. Freeman
 Introduction to the Practice of StatisticsStatisticsISBN:9781319013387Author:David S. Moore, George P. McCabe, Bruce A. CraigPublisher:W. H. Freeman