
Videos
(Appendix 3A) Scattergraph, High-Low Method, Method of Least Squares, Use of Judgment
The management of Wheeler Company has decided to develop cost formulas for its major
Note: For the following requirements, round the fixed cost to the nearest dollar, round the variable rates to three decimal places, and the R2 to two decimal places.
Required:
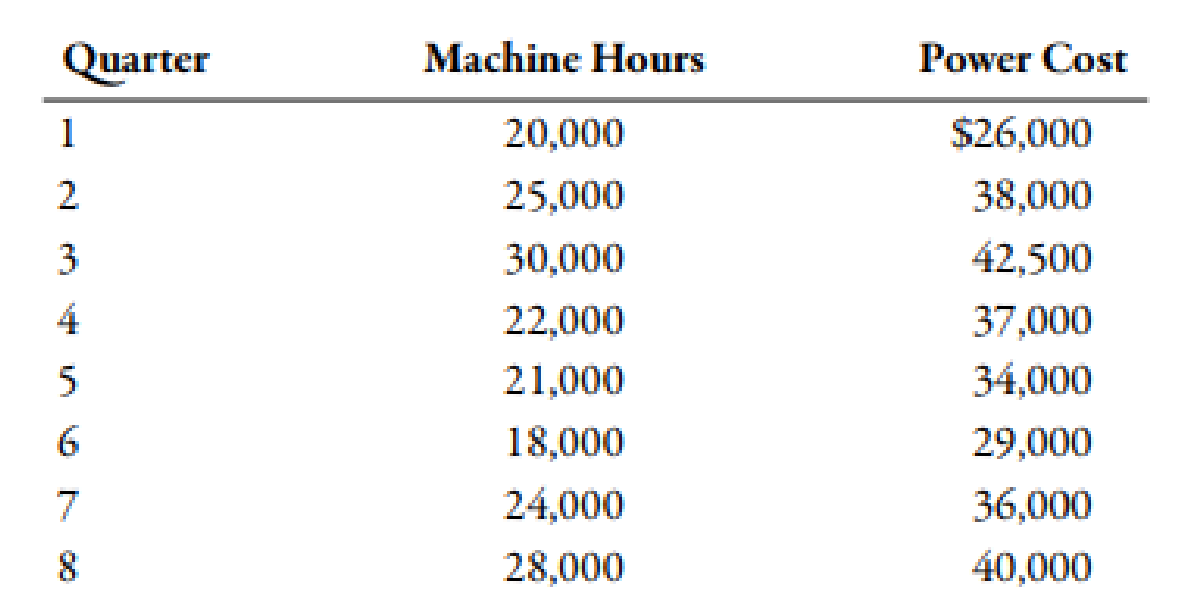
- 1. Prepare a scattergraph by plotting power costs against machine hours. Does the scatter-graph show a linear relationship between machine hours and power cost?
- 2. Using the high and low points (i.e., the high-low method), compute a power cost formula. (Note: Round answers to three decimal places.)
- 3. Use the method of least squares to compute a power cost formula. Evaluate the coefficient of determination.
- 4. CONCEPTUAL CONNECTION Rerun the regression, and drop the point (20,000, $26,000) as an outlier. Compare the results from this regression to those for the regression in Requirement 3. Which is better?

Trending nowThis is a popular solution!

Chapter 3 Solutions
Managerial Accounting: The Cornerstone of Business Decision-Making


- The management of Wheeler Company has decided to develop cost formulas for its major overhead activities. Wheeler uses a highly automated manufacturing process, and power costs are a significant manufacturing cost. Cost analysts have decided that power costs are mixed; thus, they must be broken into their fixed and variable elements so that the cost behavior of the power usage activity can be properly described. Machine hours have been selected as the activity driver for power costs. The following data for the past eight quarters have been collected: Required: 1. Prepare a scattergraph by plotting power costs against machine hours. Does the scatter-graph show a linear relationship between machine hours and power cost? 2. Using the high and low points, compute a power cost formula. 3. Use the method of least squares to compute a power cost formula. Evaluate the coefficient of determination. 4. Rerun the regression and drop the point (20,000; 26,000) as an outlier. Compare the results from this regression to those for the regression in Requirement 3. Which is better?arrow_forwardExplain how a plantwide overhead rate, using a unit-based driver, can produce distorted product costs. In your answer, identify two major factors that impair the ability of plantwide rates to assign cost accurately.arrow_forwardLarsen, Inc., produces two types of electronic parts and has provided the following data: There are four activities: machining, setting up, testing, and purchasing. Required: 1. Calculate the activity consumption ratios for each product. 2. Calculate the consumption ratios for the plantwide rate (direct labor hours). When compared with the activity ratios, what can you say about the relative accuracy of a plantwide rate? Which product is undercosted? 3. What if the machine hours were used for the plantwide rate? Would this remove the cost distortion of a plantwide rate?arrow_forward
- Which of the following is a reason a company would implement activity-based costing? A. The cost of record keeping is high. B. The additional data obtained through traditional allocation are not worth the cost. C. They want to improve the data on which decisions are made. D. A company only has one cost driver.arrow_forwardRandy Harris, controller, has been given the charge to implement an advanced cost management system. As part of this process, he needs to identify activity drivers for the activities of the firm. During the past four months, Randy has spent considerable effort identifying activities, their associated costs, and possible drivers for the activities costs. Initially, Randy made his selections based on his own judgment using his experience and input from employees who perform the activities. Later, he used regression analysis to confirm his judgment. Randy prefers to use one driver per activity, provided that an R2 of at least 80 percent can be produced. Otherwise, multiple drivers will be used, based on evidence provided by multiple regression analysis. For example, the activity of inspecting finished goods produced an R2 of less than 80 percent for any single activity driver. Randy believes, however, that a satisfactory cost formula can be developed using two activity drivers: the number of batches and the number of inspection hours. Data collected for a 14-month period are as follows: Required: 1. Calculate the cost formula for inspection costs using the two drivers, inspection hours and number of batches. Are both activity drivers useful? What does the R2 indicate about the formula? 2. Using the formula developed in Requirement 1, calculate the inspection cost when 300 inspection hours are used and 30 batches are produced. Prepare a 90 percent confidence interval for this prediction.arrow_forwardThe management of Hartman Company is trying to determine the amount of each of two products to produce over the coming planning period. The following information concerns labor availability, labor utilization, and product profitability: a. Develop a linear programming model of the Hartman Company problem. Solve the model to determine the optimal production quantities of products 1 and 2. b. In computing the profit contribution per unit, management does not deduct labor costs because they are considered fixed for the upcoming planning period. However, suppose that overtime can be scheduled in some of the departments. Which departments would you recommend scheduling for overtime? How much would you be willing to pay per hour of overtime in each department? c. Suppose that 10, 6, and 8 hours of overtime may be scheduled in departments A, B, and C, respectively. The cost per hour of overtime is 18 in department A, 22.50 in department B, and 12 in department C. Formulate a linear programming model that can be used to determine the optimal production quantities if overtime is made available. What are the optimal production quantities, and what is the revised total contribution to profit? How much overtime do you recommend using in each department? What is the increase in the total contribution to profit if overtime is used?arrow_forward
- Because of high production-changeover time and costs, a director of manufacturing must convince management that a proposed manufacturing method reduces costs before the new method can be implemented. The current production method operates with a mean cost of $220 per hour. A research study will measure the cost of the new method over a sample production period. Develop the null and alternative hypotheses most appropriate for this study. Comment on the conclusion when H0 cannot be rejected. Comment on the conclusion when H0 can be rejected.arrow_forwardClassify the following cost drivers as structural, executional, or operational. a. Number of plants b. Number of moves c. Degree of employee involvement d. Capacity utilization e. Number of product lines f. Number of distribution channels g. Engineering hours h. Direct labor hours i. Scope j. Product configuration k. Quality management approach l. Number of receiving orders m. Number of defective units n. Employee experience o. Types of process technologies p. Number of purchase orders q. Type and efficiency of layout r. Scale s. Number of functional departments t. Number of planning meetingsarrow_forwardAbernathy, Inc., produces two different generators and is concerned about their quality. The company has identified the following quality activities and costs associated with the two products: Required: 1. Calculate the quality cost per unit for each product, and break this unit cost into quality cost categories. Which of the two seems to have the lowest quality? 2. How might a manager use the unit quality cost information?arrow_forward
- The controller of the South Charleston plant of Ravinia, Inc., monitored activities associated with materials handling costs. The high and low levels of resource usage occurred in September and March for three different resources associated with materials handling. The number of moves is the driver. The total costs of the three resources and the activity output, as measured by moves for the two different levels, are presented as follows: Required: 1. Determine the cost behavior formula of each resource. Use the high-low method to assess the fixed and variable components. 2. Using your knowledge of cost behavior, predict the cost of each item for an activity output level of 9,000 moves. 3. Construct a cost formula that can be used to predict the total cost of the three resources combined. Using this formula, predict the total materials handling cost if activity output is 9,000 moves. In general, when can cost formulas be combined to form a single cost formula?arrow_forwardAuflegger, Inc., manufactures a product that experiences the following activities (and times): Required: 1. Compute the MCE for this product. 2. A study lists the following root causes of the inefficiencies: poor quality components from suppliers, lack of skilled workers, and plant layout. Suggest a possible cost reduction strategy, expressed as a series of if-then statements that will reduce MCE and lower costs. Finally, prepare a strategy map that illustrates the causal paths. In preparing the map, use only three perspectives: learning and growth, process, and financial. 3. Is MCE a lag or a lead measure? If and when MCE acts as a lag measure, what lead measures would affect it?arrow_forwardSouthward Company has implemented a JIT flexible manufacturing system. John Richins, controller of the company, has decided to reduce the accounting requirements given the expectation of lower inventories. For one thing, he has decided to treat direct labor cost as a part of overhead and to discontinue the detailed direct labor accounting of the past. The company has created two manufacturing cells, each capable of producing a family of products: the radiator cell and the water pump cell. The output of both cells is sold to a sister division and to customers who use the radiators and water pumps for repair activity. Product-level overhead costs outside the cells are assigned to each cell using appropriate drivers. Facility-level costs are allocated to each cell on the basis of square footage. The budgeted direct labor and overhead costs are as follows: The predetermined conversion cost rate is based on available production hours in each cell. The radiator cell has 45,000 hours available for production, and the water pump cell has 27,000 hours. Conversion costs are applied to the units produced by multiplying the conversion rate by the actual time required to produce the units. The radiator cell produced 81,000 units, taking 0.5 hour to produce one unit of product (on average). The water pump cell produced 90,000 units, taking 0.25 hour to produce one unit of product (on average). Other actual results for the year are as follows: All units produced were sold. Any conversion cost variance is closed to Cost of Goods Sold. Required: 1. Calculate the predetermined conversion cost rates for each cell. 2. Prepare journal entries using backflush accounting. Assume two trigger points, with completion of goods as the second trigger point. 3. Repeat Requirement 2, assuming that the second trigger point is the sale of the goods. 4. Explain why there is no need to have a work-in-process inventory account. 5. Two variants of backflush costing were presented in which each used two trigger points, with the second trigger point differing. Suppose that the only trigger point for recognizing manufacturing costs occurs when the goods are sold. How would the entries be listed here? When would this backflush variant be considered appropriate?arrow_forward
 Managerial Accounting: The Cornerstone of Busines...AccountingISBN:9781337115773Author:Maryanne M. Mowen, Don R. Hansen, Dan L. HeitgerPublisher:Cengage Learning
 Cornerstones of Cost Management (Cornerstones Ser...AccountingISBN:9781305970663Author:Don R. Hansen, Maryanne M. MowenPublisher:Cengage Learning
 Essentials of Business Analytics (MindTap Course ...StatisticsISBN:9781305627734Author:Jeffrey D. Camm, James J. Cochran, Michael J. Fry, Jeffrey W. Ohlmann, David R. AndersonPublisher:Cengage Learning
 Managerial AccountingAccountingISBN:9781337912020Author:Carl Warren, Ph.d. Cma William B. TaylerPublisher:South-Western College Pub
 Financial And Managerial AccountingAccountingISBN:9781337902663Author:WARREN, Carl S.Publisher:Cengage Learning,
 Principles of Accounting Volume 2AccountingISBN:9781947172609Author:OpenStaxPublisher:OpenStax College