Q: Use the mass spectrometry data from Table 3.1 to determine the RM M for the protein. +14 +13 +12 Table 3.1 Data for Figure 3.5 +15 Measured +11 m/z 1193.417 108.381 1085.036 90.353 +16 994.683 76.437 +10 918.246 65.517 Figure 3.5 Example mass spectrometry data for an intact protein of theoretical RMM 11924.2 (solid bars) with calculated charge (z) indicated. The shaded peaks indicate possible impurities. 852.729 56.782 795.947 49.685 1000 746.262 800 900 1100 1200 m/z
Q: Use the mass spectrometry data from Table 3.1 to determine the RM M for the protein. +14 +13 +12 Table 3.1 Data for Figure 3.5 +15 Measured +11 m/z 1193.417 108.381 1085.036 90.353 +16 994.683 76.437 +10 918.246 65.517 Figure 3.5 Example mass spectrometry data for an intact protein of theoretical RMM 11924.2 (solid bars) with calculated charge (z) indicated. The shaded peaks indicate possible impurities. 852.729 56.782 795.947 49.685 1000 746.262 800 900 1100 1200 m/z

Chapter33: High-performance Liquid Chromatography
Section: Chapter Questions
Problem 33.12QAP

Related questions
Question
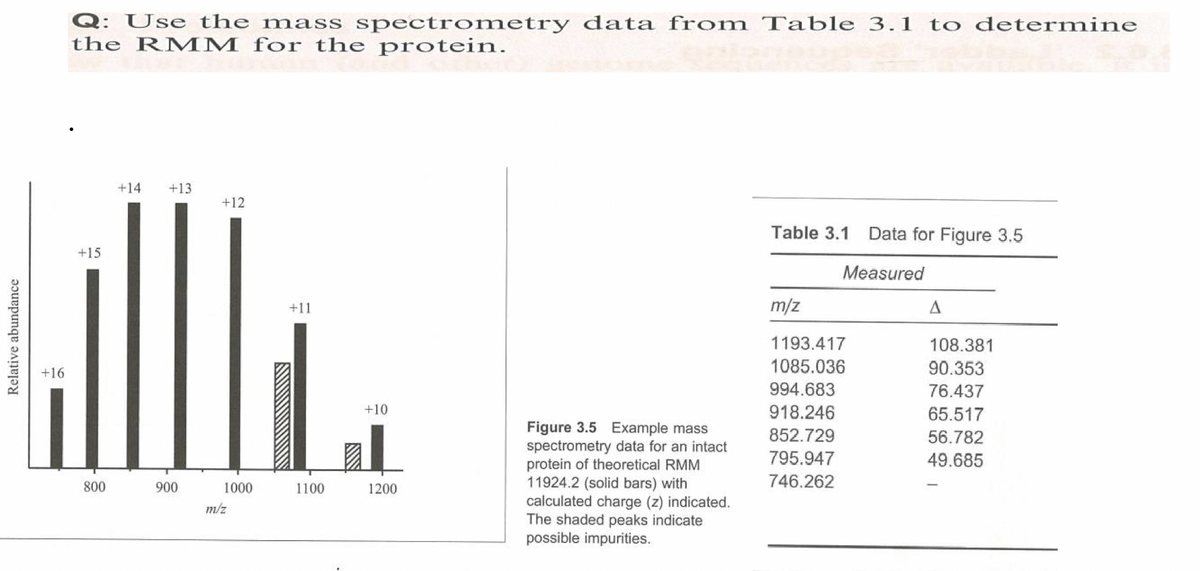
Transcribed Image Text:Q: Use the mass spectrometry data from Table 3.1 to determine
the RMM for the protein.
+14
+13
+12
Table 3.1 Data for Figure 3.5
+15
Measured
+11
m/z
1193.417
108.381
1085.036
90.353
+16
994.683
76.437
+10
918.246
65.517
Figure 3.5 Example mass
spectrometry data for an intact
protein of theoretical RMM
11924.2 (solid bars) with
calculated charge (z) indicated.
The shaded peaks indicate
possible impurities.
852.729
56.782
795.947
49.685
746.262
800
900
1000
1100
1200
m/z
Relative abundance
Expert Solution
This question has been solved!
Explore an expertly crafted, step-by-step solution for a thorough understanding of key concepts.

Step by step
Solved in 2 steps

Knowledge Booster


Learn more about
Need a deep-dive on the concept behind this application? Look no further. Learn more about this topic, chemistry and related others by exploring similar questions and additional content below.Recommended textbooks for you

Principles of Instrumental Analysis
Chemistry
ISBN:
9781305577213
Author:
Douglas A. Skoog, F. James Holler, Stanley R. Crouch
Publisher:
Cengage Learning
Principles of Instrumental Analysis
Chemistry
ISBN:
9781305577213
Author:
Douglas A. Skoog, F. James Holler, Stanley R. Crouch
Publisher:
Cengage Learning