
Introduction To Statistics And Data Analysis
6th Edition
ISBN: 9781337793612
Author: PECK, Roxy.
Publisher: Cengage Learning,
expand_more
expand_more
format_list_bulleted
Videos
Textbook Question
Chapter 5, Problem 70CR
The following data on x = Score on a measure of test anxiety and y = Exam score for a sample of n = 9 students are consistent with summary quantities given in the paper “Effects of Humor on Test Anxiety and Performance” (Psychological Reports [1999]: 1203–1212):
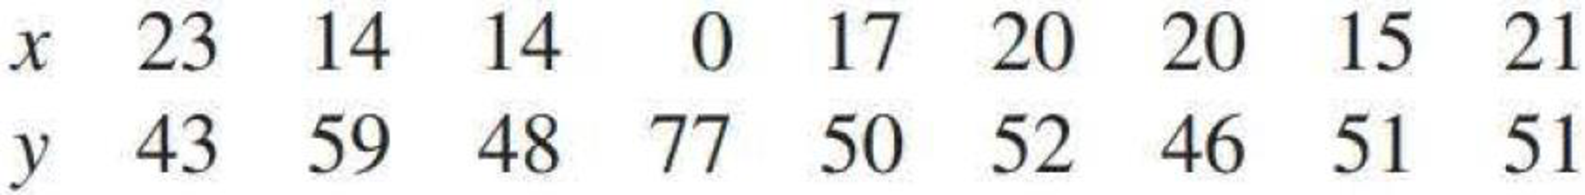
Higher values for x indicate higher levels of anxiety.
- a. Construct a
scatterplot , and comment on the features of the plot. - b. Does there appear to be a linear relationship between the two variables? How would you characterize the relationship?
- c. Calculate the value of the
correlation coefficient . Is the value of r consistent with your answer to Part (b)? - d. Is it reasonable to conclude that test anxiety caused poor exam performance? Explain.
Expert Solution & Answer

Trending nowThis is a popular solution!

Students have asked these similar questions
A major credit card company is interested in whether there is a linear relationship between its internal rating of a customer’s credit risk and that of an independent rating agency. The company collected a random sample of 200 customers and used the data to test the claim that there is a linear relationship. The following hypotheses were used to test the claim.
H0:β1=0Ha:β1≠0
The test yielded a t-value of 3.34 with a corresponding p-value of 0.001. Which of the following is the correct interpretation of the p-value?
If the alternative hypothesis is true, the probability of observing a test statistic at least as extreme as 3.34 is 0.001.
If the alternative hypothesis is true, the probability of observing a test statistic at least as extreme as 3.34 is 0.001.
A
If the alternative hypothesis is true, the probability of observing a test statistic of 3.34 or greater is 0.001.
If the alternative hypothesis is true, the probability of observing a test statistic of 3.34 or greater…
1. The following data has been collected to determine if a relationship exists between the amountof snowfall in Toronto and the number of students who attend lecture at U of T.Year Snowfall, x (cm) Number of students in class, y1995 173 1821996 165 1901997 152 2071998 184 1801999 178 184a. Determine the line of best fit by creating a scatter plot in Excel, a trendline, and thecorrelation coefficient. Make sure your scatter plot is properly titled and formatted.b. Explain what this correlation tells you about the relationship between the amount ofsnowfall and the number of students who attend lecture.c. How many students could we expect to attend a lecture if it were to snow 160 cm in aseason. Is this an example of interpolation or extrapolation?
Consider the following sample of production volumes and total cost data for a manufacturing operation.
Production Volume(units)
Total Cost($)
400
4,000
450
4,900
550
5,300
600
5,900
700
6,400
750
7,000
This data was used to develop an estimated regression equation,
ŷ = 1,121.33 + 7.76x,
relating production volume and cost for a particular manufacturing operation. Use
? = 0.05
to test whether the production volume is significantly related to the total cost. (Use the F test.)
State the null and alternative hypotheses.
-H0: ?1 ≠ 0Ha: ?1 = 0
-H0: ?1 ≥ 0Ha: ?1 < 0
-H0: ?0 ≠ 0Ha: ?0 = 0
-H0: ?1 = 0Ha: ?1 ≠ 0
-H0: ?0 = 0Ha: ?0 ≠ 0
Set up the ANOVA table. (Round your p-value to three decimal places and all other values to two decimal places.)
Sourceof Variation
Sumof Squares
Degreesof Freedom
MeanSquare
F
p-value
Regression
?
?
?
?
?
Error
?
?
?
Total
?
?
Find the value of the test statistic. (Round your answer to two decimal places.)
Test…
Chapter 5 Solutions
Introduction To Statistics And Data Analysis
Ch. 5.1 - For each of the scatterplots shown, answer the...Ch. 5.1 - For each of the following pairs of variables,...Ch. 5.1 - For each of the following pairs of variables,...Ch. 5.1 - For each of the following pairs of variables,...Ch. 5.1 - Is the following statement correct? Explain why or...Ch. 5.1 - Draw a scatterplot for which r = 1.Ch. 5.1 - Draw a scatterplot for which r = 1.Ch. 5.1 - Each year J.D. Power and Associates surveys new...Ch. 5.1 - The accompanying data are x = Cost (cents per...Ch. 5.1 - The authors of the paper Flat-footedness Is Not a...
Ch. 5.1 - The paper The Relationship Between Cell Phone Use,...Ch. 5.1 - Data from the U.S. Federal Reserve Board (federal...Ch. 5.1 - The article 115K! The 13 Best Paying U.S....Ch. 5.1 - It may seem odd, but one of the ways biologists...Ch. 5.1 - An auction house released a list of 25 recently...Ch. 5.1 - A sample of automobiles traversing a certain...Ch. 5.2 - Two scatterplots are shown below. Explain why it...Ch. 5.2 - The authors of the paper Statistical Methods for...Ch. 5.2 - The accompanying data are a subset of data from...Ch. 5.2 - The authors of the paper Evaluating Existing...Ch. 5.2 - The authors of the paper referenced in the...Ch. 5.2 - A sample of 548 ethnically diverse students from...Ch. 5.2 - The relationship between hospital patient-to-nurse...Ch. 5.2 - The report Airline Quality Rating 2016...Ch. 5.2 - Acrylamide is a chemical that is sometimes found...Ch. 5.2 - Use the acrylamide data given in the previous...Ch. 5.2 - Studies have shown that people who suffer sudden...Ch. 5.2 - The data given in the previous exercise on x =...Ch. 5.2 - An article on the cost of housing in Califomia...Ch. 5.2 - The following data on sale price, size, and...Ch. 5.2 - Explain why it can be dangerous to use the...Ch. 5.2 - The sales manager of a large company selected a...Ch. 5.2 - Explain why the slope b of the least-squares line...Ch. 5.2 - Prob. 34ECh. 5.3 - Does it pay to stay in school? The report Trends...Ch. 5.3 - The data in the accompanying table is from the...Ch. 5.3 - The paper referenced in the previous exercise also...Ch. 5.3 - Consider the residual plot from the previous...Ch. 5.3 - The report Airline Quality Rating 2016...Ch. 5.3 - Acrylamide is a chemical that is sometimes found...Ch. 5.3 - Consider the scatterplot of acrylamide...Ch. 5.3 - Some types of algae have the potential to cause...Ch. 5.3 - The relationship between x = Total number of...Ch. 5.3 - The residuals from the least-squares line for the...Ch. 5.3 - The first Batman movie was made over 50 years ago...Ch. 5.3 - The article 115K! The 13 Best Paying U.S....Ch. 5.3 - The article Examined Life: What Stanley H. Kaplan...Ch. 5.3 - The accompanying data are a subset of data from...Ch. 5.3 - The article California State Parks Closure List...Ch. 5.3 - The article referenced in the previous exercise...Ch. 5.3 - A study was carried out to investigate the...Ch. 5.3 - Both r2 and se are used to assess the fit of a...Ch. 5.3 - Prob. 53ECh. 5.4 - The following data on x = Frying time (in seconds)...Ch. 5.4 - Use the information provided in the previous...Ch. 5.4 - The paper Aspects of Food Finding by Wintering...Ch. 5.4 - Food intake of grazing animals is limited by the...Ch. 5.4 - A study, described in the paper Prediction of...Ch. 5.4 - Prob. 59ECh. 5.4 - The following table gives the number of heart...Ch. 5.4 - Refer to the heart transplant data given in the...Ch. 5.4 - The paper Population Pressure and Agricultural...Ch. 5.4 - Determining the age of an animal can sometimes be...Ch. 5.5 - The paper How Lead Exposure Relates to Temporal...Ch. 5.5 - The following quote is from the paper Evaluation...Ch. 5 - The accompanying data represent x = Amount of...Ch. 5 - The paper A Cross-National Relationship Between...Ch. 5 - The following data on x = Score on a measure of...Ch. 5 - The paper Effects of Canine Parvovirus (CPV) on...Ch. 5 - The paper Depression, Body Mass Index, and Chronic...Ch. 5 - The paper Aspects of Food Finding by Wintering...Ch. 5 - Data on salmon availability (x) and the percentage...Ch. 5 - No tortilla chip lover likes soggy chips, so it is...Ch. 5 - The article Reduction is Soluble Protein and...Ch. 5 - The following quote is from the paper The Weight...Ch. 5 - An accurate assessment of oxygen consumption...Ch. 5 - Consider the four (x, y) pairs (0, 0), (1, 1), 1,...Ch. 5 - Prob. 1CRECh. 5 - Data from a survey of 1046 adults age 50 and older...Ch. 5 - Prob. 3CRECh. 5 - Prob. 4CRECh. 5 - Prob. 5CRECh. 5 - The amount of money spent each year on science,...Ch. 5 - Below are the data used to construct the time...Ch. 5 - In August 2009, Harris Interactive released the...Ch. 5 - Prob. 9CRECh. 5 - Prob. 10CRECh. 5 - Prob. 11CRECh. 5 - Prob. 12CRECh. 5 - Cost-to-charge ratios (the percentage of the...Ch. 5 - In the article Reproductive Biology of the Aquatic...Ch. 5 - Prob. 15CRECh. 5 - Anabolic steroid abuse has been increasing despite...Ch. 5 - Prob. 81ECh. 5 - Prob. 82ECh. 5 - Prob. 83ECh. 5 - Prob. 84ECh. 5 - Suppose the hypothetical data below are from a...Ch. 5 - Prob. 86E
Additional Math Textbook Solutions
Find more solutions based on key concepts
UW Student survey In a University of Wisconsin (UW) study about alcohol abuse among students, 100 of the 40,858...
Statistics: The Art and Science of Learning from Data (4th Edition)
Refer to the Real Estate data, which reports information on homes sold in the Goodyear, Arizona, area during th...
Statistical Techniques in Business and Economics
16. Singers The display shows the heights of some of the singers in a chorus, collected so that the singers cou...
STATS:DATA+MODELS-W/DVD
Four different beverages are sold at a fast-food restaurant: soft drinks, tea, coffee, and bottled water. a. Ex...
Basic Business Statistics, Student Value Edition
The data in Table 1A were collected from one of the authors’ statistics classes. The first row gives the variab...
Introductory Statistics
1. How is a sample related to a population?
Elementary Statistics: Picturing the World (6th Edition)
Knowledge Booster


Learn more about
Need a deep-dive on the concept behind this application? Look no further. Learn more about this topic, statistics and related others by exploring similar questions and additional content below.Similar questions
- Find the equation of the regression line for the following data set. x 1 2 3 y 0 3 4arrow_forwardA random sample of 9 statistics students produced the following data, Midterm Exam Score, x Final Exam Score, y 81 49 62 23 76 84 26 58 96 33 38 36 10 15 15 83 81 28 where x measures the midterm exam score and y measures the final exam score. What is the estimate of the y = a x + b regression intercept coefficient?arrow_forwardThe following data are from a random sample of 10 students who participated in a study undertaken to investigate the effect of sleep time (measured in average number of hours of sleep per night) on GPA (grade point average, measured on a 4-point scale). Student Sleep time GPA 1 7 3.28 2 9 3.16 3 8 3.75 4 6 2.50 5 4 2.45 6 8 2.91 7 7 3.53 8 6 3.02 9 3 2.30 10 8 3.48 a. Find the equation between GPA (y) as function of sleep time (x). b. What is the estimated GPA of a student who averages 5 hours of sleep per night? c. What is the coefficient of determination? *(no use EXCEL)arrow_forward
- 2. The following data, adapted from Montgomery, Peck, and Vining (2001), present the number of certified mental defectives per 10,000 of estimated population in the United Kingdom ( y) and the number of radio receiver licenses issued (x) by the BBC (in millions) for the years 1924 through 1937. Fit a regression model relating y and x. Comment on the model. Specifically, does the existence of a strong correlation imply a cause-and-effect relationship?arrow_forwardConsider the following computer output from a multiple regression analysis relating the cost of car insurance to the variables: number of car accidents, driver’s credit score, and safety rating of the car. Coefficients Standard Error t Coefficients Stat P-value Intercept 1117 113.71 9.823 0.0000 Car Accidents(In last 3 years) 201.06 20.67 9.727 0.0000 Credit Score −122.87 13.47 −9.122 0.0000 Safety Rating −268.22 26.94 −9.956 0.0000 Does the sign of the coefficient for the variable safety rating make sense?arrow_forwardA random sample of 9 statistics students produced the following data, Midterm Exam Score, x Final Exam Score, y 18 87 84 75 48 10 22 60 46 60 92 46 69 33 93 45 28 60 where x measures the midterm exam score and y measures the final exam score. What is the estimate of the y = a x + b regression slope coefficient?arrow_forward
- The grades of a class of 9 students on a midterm report (x) and on the final examination (y) are as follows: Give the following: a. linear regression line and equation b. computation of the coefficient of determination ?^2 c. Computation of the coefficient of correlation ? d. Estimate the final examination grade of a student who received a grade of 85 on the midterm report.arrow_forwardA study was conducted to detemine whether a the final grade of a student in an introductory psychology course is linearly related to his or her performance on the verbal ability test administered before college entrance. The verbal scores and final grades for 10 students are shown in the table below. Student Verbal Score x Final Grade y 1 37 43 2 38 46 3 33 39 4 57 67 5 60 74 6 64 80 7 47 59 8 66 76 9 28 30 10 53 62 Should the regression be used to predict the final grade of a student with a verbal score of 100? answer: ?arrow_forwardThe table given below is for scores in Management Accounting M.A) and Quantitative Techniques (Q.T).StudentABCDEFGH M.A8677687167907871 Q.T8082736972858465 Test for existence of linear relationship at 5% level of significance.arrow_forward
arrow_back_ios
arrow_forward_ios
Recommended textbooks for you
 Glencoe Algebra 1, Student Edition, 9780079039897...AlgebraISBN:9780079039897Author:CarterPublisher:McGraw Hill
 Functions and Change: A Modeling Approach to Coll...AlgebraISBN:9781337111348Author:Bruce Crauder, Benny Evans, Alan NoellPublisher:Cengage Learning
Glencoe Algebra 1, Student Edition, 9780079039897...
Algebra
ISBN:9780079039897
Author:Carter
Publisher:McGraw Hill
Functions and Change: A Modeling Approach to Coll...
Algebra
ISBN:9781337111348
Author:Bruce Crauder, Benny Evans, Alan Noell
Publisher:Cengage Learning
Hypothesis Testing using Confidence Interval Approach; Author: BUM2413 Applied Statistics UMP;https://www.youtube.com/watch?v=Hq1l3e9pLyY;License: Standard YouTube License, CC-BY
Hypothesis Testing - Difference of Two Means - Student's -Distribution & Normal Distribution; Author: The Organic Chemistry Tutor;https://www.youtube.com/watch?v=UcZwyzwWU7o;License: Standard Youtube License