
Concept explainers
Videos
Acrylamide is a chemical that is sometimes found in cooked starchy foods and which is thought to increase the risk of certain kinds of cancer. The paper “A Statistical Regression Model for the Estimation of Acrylamide Concentrations in French Fries for Excess Lifetime Cancer Risk Assessment” (Food and Chemical Toxicology [2012]: 3867–3876) describes a study to investigate the effect of x = Frying time (in seconds) and y = Acrylamide concentration (in micrograms per kilogram) in French fries. The data in the accompanying table are approximate values read from a graph that appeared in the paper.
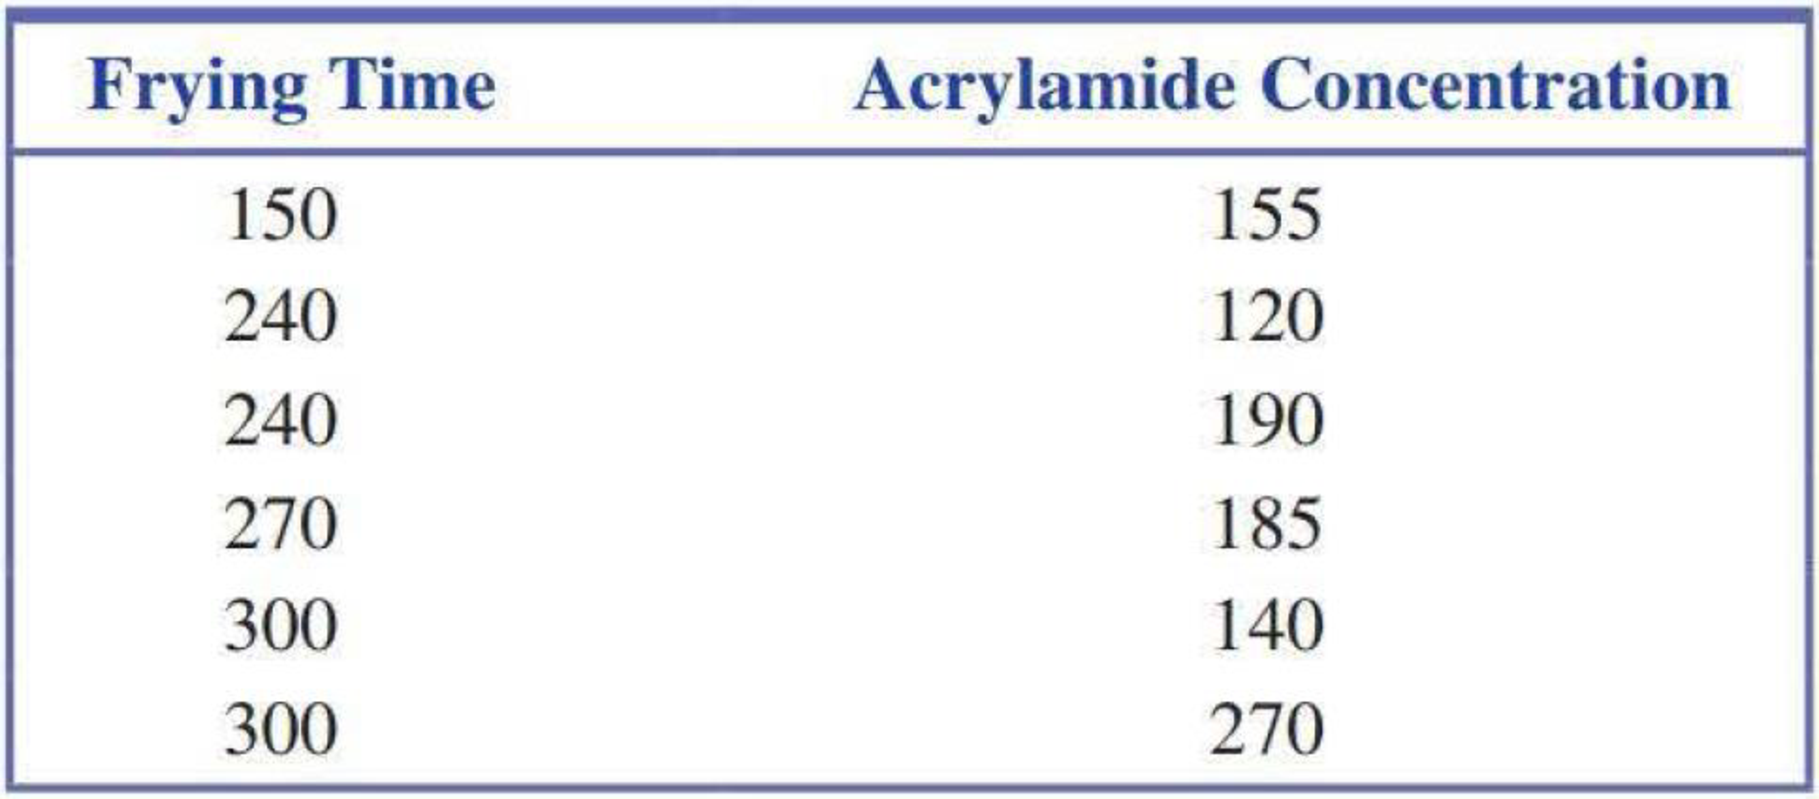
- a. Construct a
scatterplot of these data. - b. Find the equation of the least-squares line. Based on this line, what would you predict acrylamide concentration to be for a frying time of 270 seconds? What is the residual associated with the observation (270, 185)?
Want to see the full answer?
Check out a sample textbook solution
Chapter 5 Solutions
Introduction To Statistics And Data Analysis
Additional Math Textbook Solutions
Probability and Statistics for Engineering and the Sciences
Business Statistics: A First Course (8th Edition)
Basic Business Statistics, Student Value Edition
Statistical Reasoning for Everyday Life (5th Edition)
Elementary Statistics: A Step By Step Approach
PRACTICE OF STATISTICS F/AP EXAM


- The Wall Street Journal asked Concur Technologies, Inc., an expense management company, to examine data from 8.3 million expense reports to provide insights regarding business travel expenses. Their analysis of the data showed that New York was the most expensive city. The following table shows the average daily hotel room rate (X) and the average amount spent on entertainment (Y) for a random sample of 9 of the 25 most-visited U.S. cities. These data lead to the estimated regression equation y = 17.49 + 1.0334x. For these data SSE = 1541.4. Use Table 1 of Appendix B. (NEED ANSWER FOR A) a. Predict the amount spent on entertainment for a particular city that has a daily room rate of $89 (to 2 decimals).arrow_forwardSuppose an appliance manufacturer is doing a regression analysis, using quarterly time-series data, of the factors affecting its sales of appliances. A regression equation was estimated between appliance sales (in dollars) as the dependent variable and disposable personal income and new housing starts as the independent variables. The statistical tests of the model showed large t-values for both independent variables, along with a high r2 value. However, analysis of the residuals indicated that substantial autocorrelation was present.a. What are some of the possible causes of this autocorrelation?b. How does this autocorrelation affect the conclusions concerning the significance of the individual explanatory variables and the overall explanatory power of the regression model?c. Given that a person uses the model for forecasting future appliance sales, how does this autocorrelation affect the accuracy of these forecasts?d. What techniques might be used to remove this autocorrelation…arrow_forwardA researcher notes that, in a certain region, a disproportionate number of software millionaires were born around the year 1955. Is this a coincidence, or does birth year matter when gauging whether a software founder will besuccessful? The researcher investigated this question by analyzing the data shown in the accompanying table. Complete parts a through c below. a. Find the coefficient of determination for the simple linear regression model relating number (y) of software millionaire birthdays in a decade to total number (x) of births in the region. Interpret the result. The coefficient of determination is 1.___? (Round to three decimal places as needed.) This value indicates that 2.____ of the sample variation in the number of software millionaire birthdays is explained by the linear relationship with the total number of births in the region. (Round to one decimal place as needed.) b. Find the coefficient of determination for the simple linear regression model…arrow_forward
- The regression output is reported in Table 4. Why does Stata omit hhsize3? Would it make any difference if Stata omitted hhsize3 instead of hhsize1?arrow_forwardA study was done to determine the relationship between the alcohol content of beer, and the amount of calories in a 12 oz serving size. The sample data is provided in the data below. a) From this sample data, can you conclude (at the alpha=0.05 level) that there is in fact a linear correlation between the two variables? Use the statistics (correlation coefficient, value) to describe the correlation (if any). B) Using the sample data, find a regression equation to estimate the number of calories in a beer. C) Dogfish Head Brewery in Milton, Delaware has an I.P.A. beer called "120 minute IPA" which has an alcohol content of 18%. Using your regression equation, estimate the number of calories in a 12 oz serving of 120 Minute. Brand/Beer Alcohol Content (%) Calories (per 12 oz) Big Sky Scape Goat Pale Ale 4.70 163 Sierra Nevada Harvest Ale 6.70 215 Steel Reserve 8.10 222 Coors Light 4.15 104 Genesee Cream Ale 5.10 162 Sierra Nevada Summeefest Beer 5.00 158 Michelob Beer…arrow_forwardThe Update to the Task Force Report on Blood Pressure Control in Children [12] reported the observed 90th per-centile of SBP in single years of age from age 1 to 17 based on prior studies. The data for boys of average height are given in Table 11.18. Suppose we seek a more efficient way to display the data and choose linear regression to accomplish this task. age sbp 1 99 2 102 3 105 4 107 5 108 6 110 7 111 8 112 9 114 10 115 11 117 12 120 13 122 14 125 15 127 16 130 17 132 Do you think the linear regression provides a good fit to the data? Why or why not? Use residual analysis to justify your answer. Am I supposed to run a residual plot and QQ-plot for this question?arrow_forward
- Data was collected on 54 observations on a response of interest, y, and four potential predictor variables x1, x2, x3, and x4. The output from regression analyses of the data is attached to the end of the page. d) Is the variable from your best simple linear regression model (from part a) included in the model with the lowest overall MSE (part b)? Briefly explain why it could happen that the best single variable is not in the best overall model. e) Following the best subsets regression results, the sums of squares for regression and error (also called residual) are displayed for several models. Using the regression sums of squares information for the full model containing all four x variables, calculate i) the R2 value for the full model, ii) the F statistic for the test of the H0: b1 = b2 = b3 = b4 = 0, and iii) the standard deviation of the residuals for the full model. f) Using the regression sums of squares information, test the null hypothesis H0:b2 = b4 = 0 for the full model.…arrow_forwardWhich of the multivariate regression parameters listed below would be best interpreted as: the predicted value on the dependent variable when all of the independent variables in the model are equal to zero. a b1 X1 R2arrow_forwardFor a linear regression for a sample of n=20 pairs of X and Y values. What is the value of the degrees of freedom for the predicted portion of the Y-score variance, MSregression?arrow_forward
- If the R-squared for a regression model relating the outcome y to an explanatory variable x is 0.9. This implies that y and x are positively correlated.arrow_forwardIn the following model, "employed" is a dummy indicating a person is employed: donation = B + B edu + Bemployed + uT Running this model will produce the same results of differential in donation between employed people and unemployed people as running two separate regressions for employed people and unemployed people. A. True B. Falsearrow_forwardThe issue of multicollinearity impacted the 'vadity and trustworthiness' of a regression model. demonstrate how this issue can be a problem by using an appropriate hypothetical and mathematical example.arrow_forward
 MATLAB: An Introduction with ApplicationsStatisticsISBN:9781119256830Author:Amos GilatPublisher:John Wiley & Sons Inc
 Probability and Statistics for Engineering and th...StatisticsISBN:9781305251809Author:Jay L. DevorePublisher:Cengage Learning
 Statistics for The Behavioral Sciences (MindTap C...StatisticsISBN:9781305504912Author:Frederick J Gravetter, Larry B. WallnauPublisher:Cengage Learning
 Elementary Statistics: Picturing the World (7th E...StatisticsISBN:9780134683416Author:Ron Larson, Betsy FarberPublisher:PEARSON
 The Basic Practice of StatisticsStatisticsISBN:9781319042578Author:David S. Moore, William I. Notz, Michael A. FlignerPublisher:W. H. Freeman
 Introduction to the Practice of StatisticsStatisticsISBN:9781319013387Author:David S. Moore, George P. McCabe, Bruce A. CraigPublisher:W. H. Freeman