
Concept explainers
Videos
a.
Draw the plots of the proportion of bird eggs hatching for the lowlands and mid-elevation areas versus exposure time.
Identify whether the shapes of the plots are as expected in case of “logistic” plots.
a.
Answer to Problem 83E
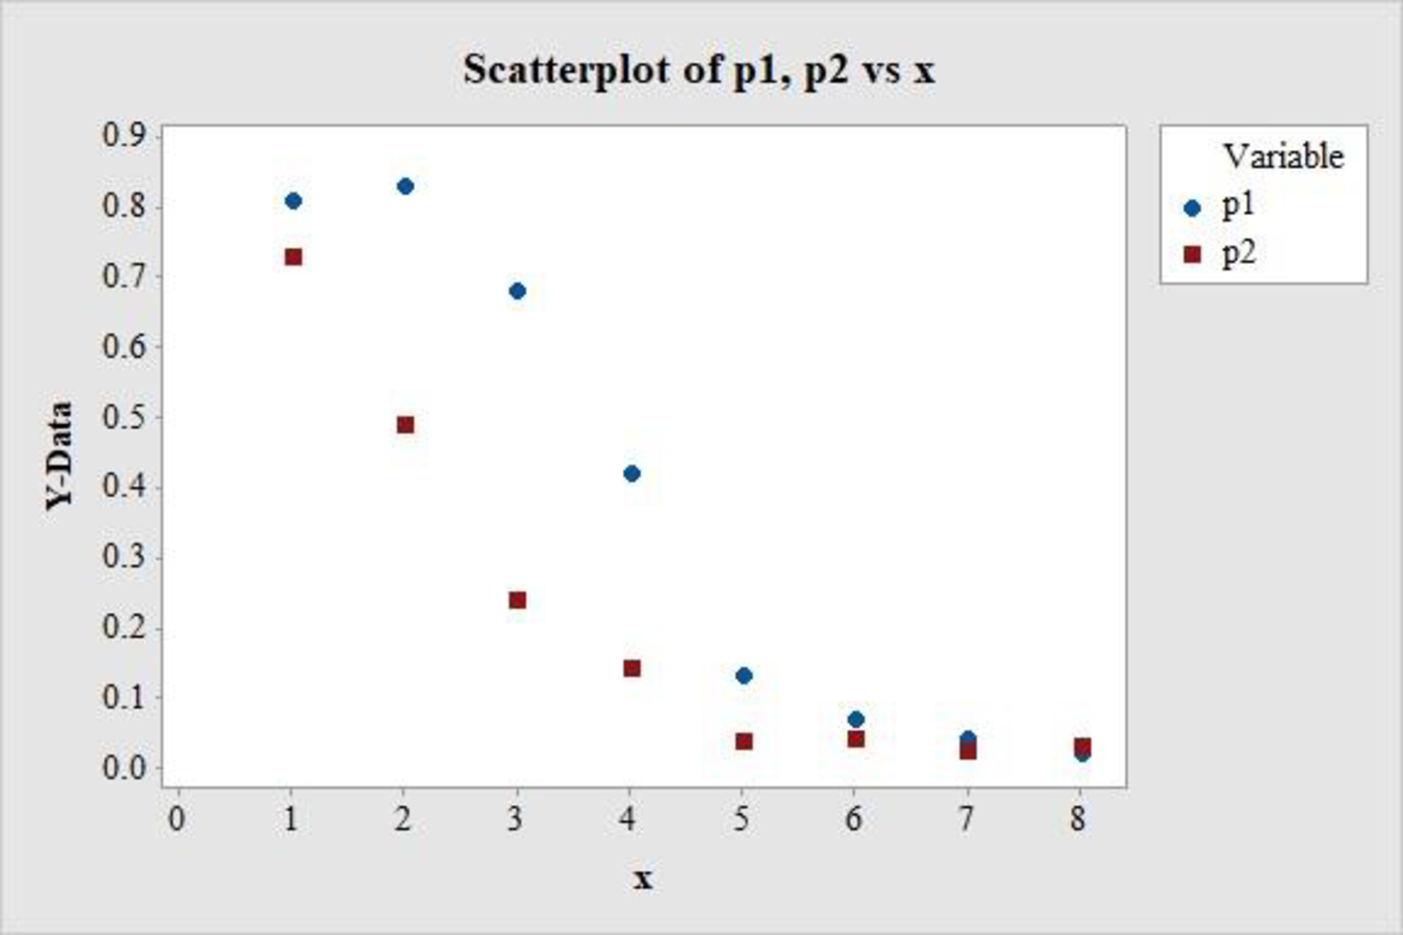
The plot of the proportion of bird eggs hatching for the lowlands and mid-elevation areas versus exposure time is as follows:
Explanation of Solution
Calculation:
The given data relates the proportion of bird eggs hatching for the lowlands, mid-elevation areas and cloud-forests with exposure time (days).
Denote the proportion of hatching for lowlands as
Software procedure:
Step-by-step procedure to draw the scatterplots using MINITAB software is given below:
- Choose Graph > Scatterplot.
- Choose Simple, and then click OK.
- Enter the column of p1 in the first cell under Y variables.
- Enter the column of x in the first cell under X variables.
- Enter the column of p2 in the second cell under Y variables.
- Enter the column of x in the second cell under X variables.
- Choose Multiple Graphs.
- Select Overlaid on the same graph under Show pairs of graph variables.
- Click OK in all dialogue boxes.
Thus, the scatterplot for the data is obtained.
The logistic plots usually have an approximate S-shaped distribution. In the above scatterplot, it is observed that both the proportions have approximately extended S-shaped distributions.
Hence, the shapes of the plots are more-or-less as expected in case of “logistic” plots.
b.
Find the value of
Fit a regression line of the form
Describe the significance of the negative slope.
b.
Answer to Problem 83E
The regression line fitted to the given data is
Explanation of Solution
Calculation:
Logistic regression:
The logistic regression equation for the prediction of a probability for the given value of the explanatory variable, x, is
The values of
Data transformation
Software procedure:
Step-by-step procedure to transform the data using MINITAB software is given below:
- Choose Calc > Calculator.
- Enter the column of y* under Store result in variable.
- Enter the formula LN(‘p3’/(1–‘p3’)) under Expression.
- Click OK.
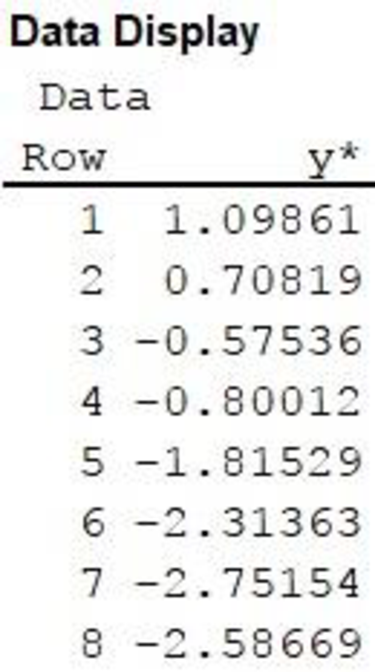
The transformed variable is stored in the column y*.
Data display:
Software procedure:
Step by step procedure to display the data using MINITAB software is given as,
- Choose Data > Display Data.
- Under Column, constants, and matrices to display, enter the column of y*.
- Click OK on all dialogue boxes.
The output using MINITAB software is given as follows:
Regression equation:
Software procedure:
Step by step procedure to obtain the regression equation using the MINITAB software:
- Choose Stat > Regression > Regression > Fit Regression Model.
- Enter the column of y* under Responses.
- Enter the columns of x under Continuous predictors.
- Choose Results and select Analysis of Variance, Model Summary, Coefficients, Regression Equation.
- Click OK in all dialogue boxes.
Output obtained using MINITAB is given below:
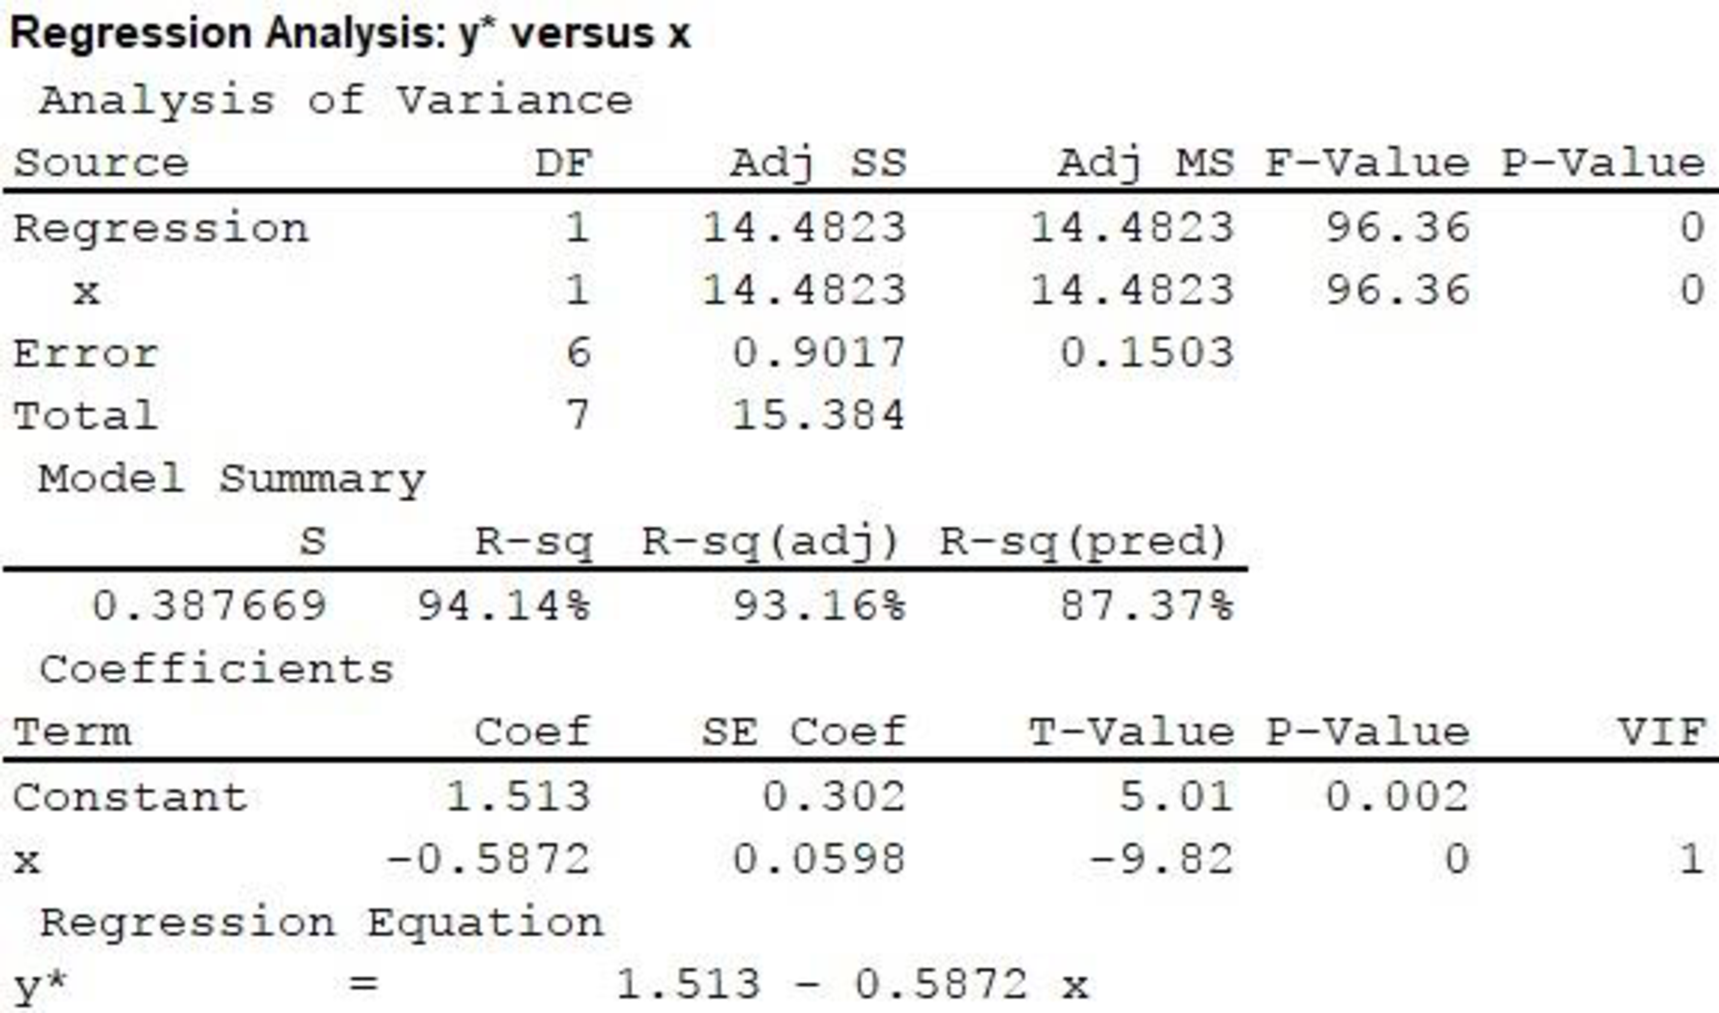
In the output, substituting
It is observed that the slope of x is –0.5872, which is negative. A negative slope implies that an increase in x causes a decrease in yꞌ.
Now, it is known that the quantity
In this case, an increase in exposure time decreases the natural logarithm of odds of hatching in the cloud forest area, which, in turn, implies a decrease in the odds of hatching.
Thus, the negative slope implies that an increase in exposure time causes a decrease in the odds of hatching of an egg in the cloud forest area.
c.
Predict the proportion of hatching in the cloud forest conditions, for an exposure time of 3 days.
Predict the proportion of hatching in the cloud forest conditions, for an exposure time of 5 days.
c.
Answer to Problem 83E
The proportion of hatching in the cloud forest conditions, for an exposure time of 3 days is 0.4382.
The proportion of hatching in the cloud forest conditions, for an exposure time of 5 days is 0.1942.
Explanation of Solution
Calculation:
For an exposure time of 3 days, substitute
Thus,
Thus, the proportion of hatching in the cloud forest conditions, for an exposure time of 3 days is 0.4382.
For an exposure time of 5 days, substitute
Thus,
Thus, the proportion of hatching in the cloud forest conditions, for an exposure time of 5 days is 0.1942.
d.
Identify the point of exposure time, at which, the proportion of hatching in the cloud forest conditions changes from greater than 0.5 to less than 0.5.
d.
Answer to Problem 83E
The exposure time, at which, the proportion of hatching in the cloud forest conditions changes from greater than 0.5 to less than 0.5 is 2.5766 days.
Explanation of Solution
Calculation:
For the proportion of hatching of 0.5, substitute
Thus,
As a result, the exposure time for the proportion of hatching of 0.5 is 2.5766 days.
Now, from the explanation in Part b, an increase in the exposure time causes a decrease in the odds of hatching in the cloud forest conditions. Thus, an increase in exposure time from 2.5766 days would cause a decrease in the proportion of hatching, whereas a decrease in exposure time from 2.5766 days would cause an increase in the proportion of hatching.
Thus, the exposure time, at which, the proportion of hatching in the cloud forest conditions changes from greater than 0.5 to less than 0.5 is 2.5766 days.
Want to see more full solutions like this?
Chapter 5 Solutions
Introduction To Statistics And Data Analysis


- Table 6 shows the population, in thousands, of harbor seals in the Wadden Sea over the years 1997 to 2012. a. Let x represent time in years starting with x=0 for the year 1997. Let y represent the number of seals in thousands. Use logistic regression to fit a model to these data. b. Use the model to predict the seal population for the year 2020. c. To the nearest whole number, what is the limiting value of this model?arrow_forwardTo the nearest whole number, what is the initial value of a population modeled by the logistic equation P(t)=1751+6.995e0.68t ? What is the carrying capacity?arrow_forwardWhat does the y -intercept on the graph of a logistic equation correspond to for a population modeled by that equation?arrow_forward
- What is the carrying capacity for a population modeled by the logistic equation P(t)=250,0001+499e0.45t ? initial population for the model?arrow_forwardWhat is the y -intercept on the graph of the logistic model given in the previous exercise?arrow_forwardThe population of a culture of bacteria is modeled by the logistic equation P(t)=14,2501+29e0.62t where t is inarrow_forward
- When predicting population growth, demographers must consider birth and death rates as well as the net change caused by the difference between the rates of immigration and emigration. Let P be the population at time t and let N be the net increase per unit time resulting from the difference between immigration and emigration. So, the rate of growth of the population is given byarrow_forwardThe following problem is based on information taken from the pediatrics section of The Merck Manual (a commonly used reference in medical schools and nursing programs). Let x be the body weight of a child (in kilograms), and let y be the metabolic rate of the child (in 100 kcal/24 h).x 13.0 24.0 25.0 24.0 19.0 14.0 6.0 18.0y 1.7 7.2 6.7 7.3 5.6 2.0 1.6 2.4Σx = 143; Σy = 34.5; Σx2 = 2863; Σy2 = 196.59; Σxy = 724.8 (a) Find Se. (Round your answer to three decimal places.) (b) Find r. (Round your answer to three decimal places.) Test that ρ is positive. Use α = 0.01. (Round your answers to three decimal places.)t = critical t = Conclusion:At the 1% level of significance, there is sufficient evidence to conclude that the population correlation coefficient is greater than zero.At the 1% level of significance, there is insufficient evidence to conclude that the population correlation coefficient is greater than zero. (c) Find b. (Round your answer to three decimal places.) Test that β is…arrow_forwardIf ω'(t) is the rate of growth of a child in pounds per year,what does ∫510 ω'(t) dt represent?arrow_forward
- The following data pertain to cosmic ray doses measured at various altitudes.Data in image 1 A) Fit an exponential curveB) Use the result from part A to estimate the mean dose at a 3000-foot unit.C) Change the equation obtained in part A to the form (image 2), then use the result to rework part B.D) Fit a Gompertz curve of the shape (image 2)arrow_forwardCreate the exponential function in the form f(x)=a(b)^x that fits the two data points given: (0,13)&(7,50) (round values to 4 decimal places)arrow_forwardi have the following regression equation Log(total deaths per million) = -3.882 + 0.934Log(total cases per million) – 0.033(gdp per capita) + 0.014(aged 70 or older) - 0.050(hospital beds per thousand) + 0.011(human development index) How would I interpret the effect of aged 70 years or older, which is the percent of the population aged 70 or olderarrow_forward
