
Introduction To Statistics And Data Analysis
6th Edition
ISBN: 9781337793612
Author: PECK, Roxy.
Publisher: Cengage Learning,
expand_more
expand_more
format_list_bulleted
Concept explainers
Videos
Textbook Question
Chapter 5.3, Problem 50E
The article referenced in the previous exercise also gave data on the percentage of operating costs covered by park revenues for the 2007–2008 fiscal year.
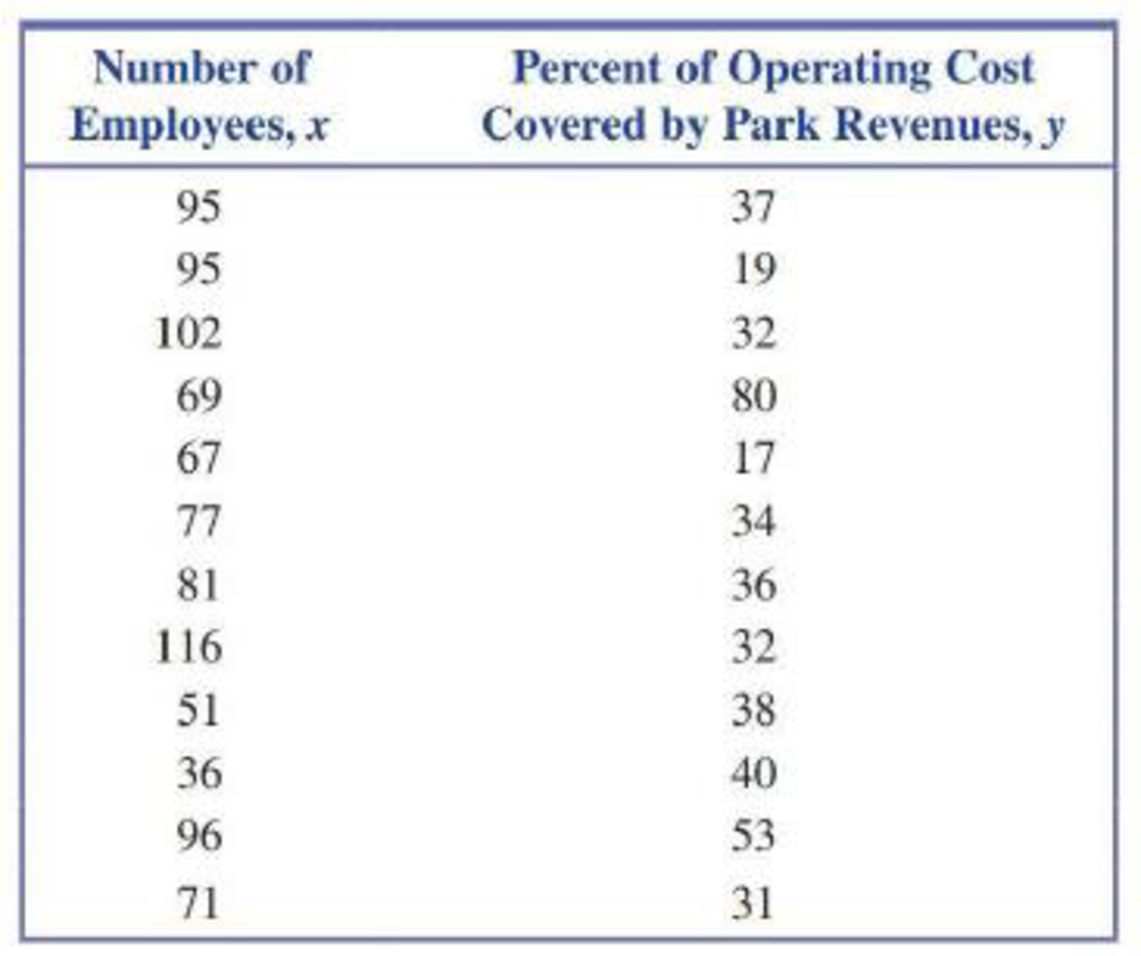
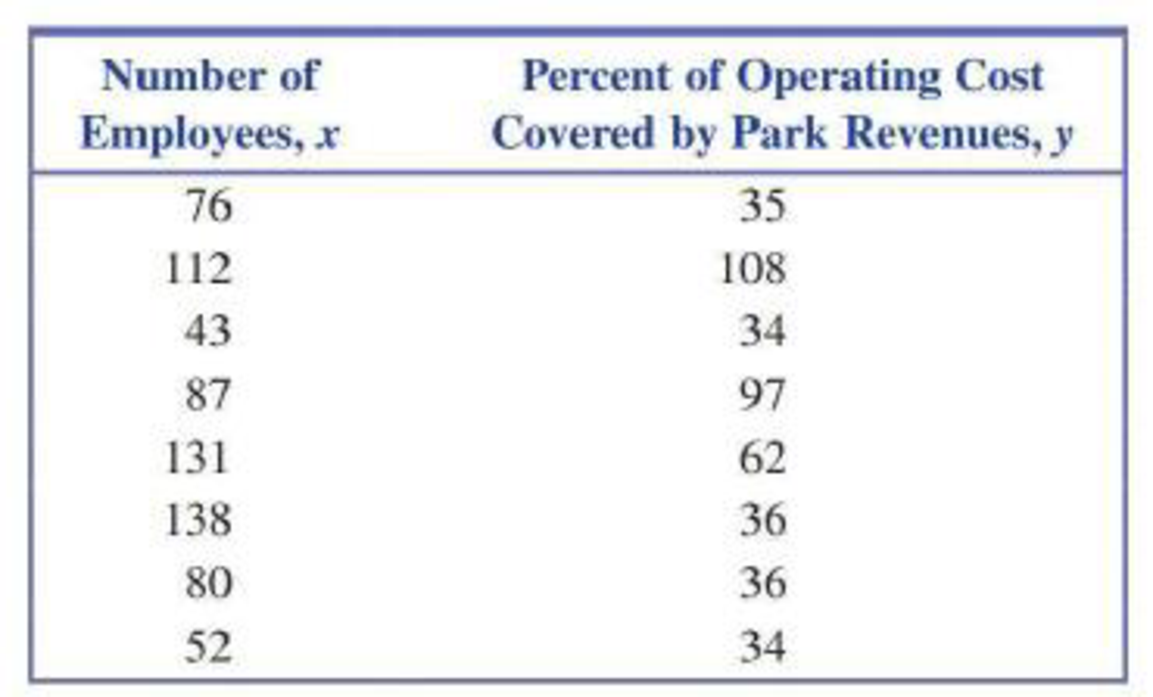
- a. Find the equation of the least-squares line relating y = Percent of operating costs covered by park revenues and x = Number of employees.
- b. Based on the values of r2 and se, do you think that the least-squares line does a good job of describing the relationship between y = Percent of operating costs covered by park revenues and x = Number of employees? Explain.
- c. The graph at the bottom of the page is a
scatterplot of y = Percent of operating costs covered by park revenues and x = Number of employees. The least-squares line is also shown. Which observations are outliers? Do the observations with the largest residuals correspond to the park districts with the largest number of employees?
Expert Solution & Answer
Want to see the full answer?
Check out a sample textbook solution
Students have asked these similar questions
A regression analysis between weight (y in pounds) and height (x in inches) resulted in following least squares line: y^= 120+5x. this implies that if the height is increased by 1 inch, the weight is expected ?
The following table shows the marks in statistics and economics for ten students. Fit a least square line to the data using
a) ‘X’ as the independent variable
b) What will be the regression equation if X= 20
A recent campus bookstore survey sought to determine if there is a relationship between new textbook prices y (dollars) and the number of pages in the book x. The resulting least-squares regression line for the study is y = 38.04 + 0.12x.
What is the predicted price when the number of pages is 75? Enter your answer as a dollar.
Chapter 5 Solutions
Introduction To Statistics And Data Analysis
Ch. 5.1 - For each of the scatterplots shown, answer the...Ch. 5.1 - For each of the following pairs of variables,...Ch. 5.1 - For each of the following pairs of variables,...Ch. 5.1 - For each of the following pairs of variables,...Ch. 5.1 - Is the following statement correct? Explain why or...Ch. 5.1 - Draw a scatterplot for which r = 1.Ch. 5.1 - Draw a scatterplot for which r = 1.Ch. 5.1 - Each year J.D. Power and Associates surveys new...Ch. 5.1 - The accompanying data are x = Cost (cents per...Ch. 5.1 - The authors of the paper Flat-footedness Is Not a...
Ch. 5.1 - The paper The Relationship Between Cell Phone Use,...Ch. 5.1 - Data from the U.S. Federal Reserve Board (federal...Ch. 5.1 - The article 115K! The 13 Best Paying U.S....Ch. 5.1 - It may seem odd, but one of the ways biologists...Ch. 5.1 - An auction house released a list of 25 recently...Ch. 5.1 - A sample of automobiles traversing a certain...Ch. 5.2 - Two scatterplots are shown below. Explain why it...Ch. 5.2 - The authors of the paper Statistical Methods for...Ch. 5.2 - The accompanying data are a subset of data from...Ch. 5.2 - The authors of the paper Evaluating Existing...Ch. 5.2 - The authors of the paper referenced in the...Ch. 5.2 - A sample of 548 ethnically diverse students from...Ch. 5.2 - The relationship between hospital patient-to-nurse...Ch. 5.2 - The report Airline Quality Rating 2016...Ch. 5.2 - Acrylamide is a chemical that is sometimes found...Ch. 5.2 - Use the acrylamide data given in the previous...Ch. 5.2 - Studies have shown that people who suffer sudden...Ch. 5.2 - The data given in the previous exercise on x =...Ch. 5.2 - An article on the cost of housing in Califomia...Ch. 5.2 - The following data on sale price, size, and...Ch. 5.2 - Explain why it can be dangerous to use the...Ch. 5.2 - The sales manager of a large company selected a...Ch. 5.2 - Explain why the slope b of the least-squares line...Ch. 5.2 - Prob. 34ECh. 5.3 - Does it pay to stay in school? The report Trends...Ch. 5.3 - The data in the accompanying table is from the...Ch. 5.3 - The paper referenced in the previous exercise also...Ch. 5.3 - Consider the residual plot from the previous...Ch. 5.3 - The report Airline Quality Rating 2016...Ch. 5.3 - Acrylamide is a chemical that is sometimes found...Ch. 5.3 - Consider the scatterplot of acrylamide...Ch. 5.3 - Some types of algae have the potential to cause...Ch. 5.3 - The relationship between x = Total number of...Ch. 5.3 - The residuals from the least-squares line for the...Ch. 5.3 - The first Batman movie was made over 50 years ago...Ch. 5.3 - The article 115K! The 13 Best Paying U.S....Ch. 5.3 - The article Examined Life: What Stanley H. Kaplan...Ch. 5.3 - The accompanying data are a subset of data from...Ch. 5.3 - The article California State Parks Closure List...Ch. 5.3 - The article referenced in the previous exercise...Ch. 5.3 - A study was carried out to investigate the...Ch. 5.3 - Both r2 and se are used to assess the fit of a...Ch. 5.3 - Prob. 53ECh. 5.4 - The following data on x = Frying time (in seconds)...Ch. 5.4 - Use the information provided in the previous...Ch. 5.4 - The paper Aspects of Food Finding by Wintering...Ch. 5.4 - Food intake of grazing animals is limited by the...Ch. 5.4 - A study, described in the paper Prediction of...Ch. 5.4 - Prob. 59ECh. 5.4 - The following table gives the number of heart...Ch. 5.4 - Refer to the heart transplant data given in the...Ch. 5.4 - The paper Population Pressure and Agricultural...Ch. 5.4 - Determining the age of an animal can sometimes be...Ch. 5.5 - The paper How Lead Exposure Relates to Temporal...Ch. 5.5 - The following quote is from the paper Evaluation...Ch. 5 - The accompanying data represent x = Amount of...Ch. 5 - The paper A Cross-National Relationship Between...Ch. 5 - The following data on x = Score on a measure of...Ch. 5 - The paper Effects of Canine Parvovirus (CPV) on...Ch. 5 - The paper Depression, Body Mass Index, and Chronic...Ch. 5 - The paper Aspects of Food Finding by Wintering...Ch. 5 - Data on salmon availability (x) and the percentage...Ch. 5 - No tortilla chip lover likes soggy chips, so it is...Ch. 5 - The article Reduction is Soluble Protein and...Ch. 5 - The following quote is from the paper The Weight...Ch. 5 - An accurate assessment of oxygen consumption...Ch. 5 - Consider the four (x, y) pairs (0, 0), (1, 1), 1,...Ch. 5 - Prob. 1CRECh. 5 - Data from a survey of 1046 adults age 50 and older...Ch. 5 - Prob. 3CRECh. 5 - Prob. 4CRECh. 5 - Prob. 5CRECh. 5 - The amount of money spent each year on science,...Ch. 5 - Below are the data used to construct the time...Ch. 5 - In August 2009, Harris Interactive released the...Ch. 5 - Prob. 9CRECh. 5 - Prob. 10CRECh. 5 - Prob. 11CRECh. 5 - Prob. 12CRECh. 5 - Cost-to-charge ratios (the percentage of the...Ch. 5 - In the article Reproductive Biology of the Aquatic...Ch. 5 - Prob. 15CRECh. 5 - Anabolic steroid abuse has been increasing despite...Ch. 5 - Prob. 81ECh. 5 - Prob. 82ECh. 5 - Prob. 83ECh. 5 - Prob. 84ECh. 5 - Suppose the hypothetical data below are from a...Ch. 5 - Prob. 86E
Knowledge Booster


Learn more about
Need a deep-dive on the concept behind this application? Look no further. Learn more about this topic, statistics and related others by exploring similar questions and additional content below.Similar questions
- Find the equation of the regression line for the following data set. x 1 2 3 y 0 3 4arrow_forwardAn bus station has determined that the relationship between the number of passengers on a bus and the total weight of luggage stored in the baggage compartment can be estimated by the least squares regression equation y=115+24xy=115+24x. Predict the weight of luggage for a flight with 60 passengers. Answer: pounds Speakarrow_forwardA recent campus bookstore survey sought to determine if there is a relationship between new textbook prices y (dollars) and the number of pages in the book x. The resulting least-squares regression line for the study is y = 38.04 + 0.12x. What is the predicted price when the number of pages is 75?arrow_forward
- The data regarding the production of wheat in tons (X) and the price of the kilo of flour in Ghana cedis (Y) Takoradi some years ago were: a. Fit the regression line for the day using the method of least squaresarrow_forwardThe accompanying data were compiled by the admissions office at a college during the past 5 years. The data relate the number of college brochures and follow-up letters (x) sent to a preselected list of high school juniors who had taken the PSAT and the number of completed applications (y) received from these students (both measured in units of a thousand). x 4 4.5 5 5.5 6 y 0.5 0.7 0.9 1 1.3 (a) Determine the equation of the least-squares line for these data.y =arrow_forwardTo determine the effectiveness of group study sessions, a college instructor gathers data on hours of attendance and exam scores for students in the class. Which variable, hours of attendance or exam scores, would be the response variable for a least-squares regression equation? is it hours of attendance or exam scores?arrow_forward
- Determine the best (according to sum-of-squares-measure) curve y = ax2 + bx + c, throughthe data above.arrow_forwardAn engineer wants to determine how the weight of a gas-powered car, x, affects the gas mileage, y. Would it be reasonable to use the least-squares regression line to predict the miles per gallon of a hybrid gas and electric car? Why and why not?arrow_forwardAn owner of a home in the Midwest installed solar panels to reduce heating costs. After installing the solar panels, he measured the amount of natural gas used ? (in cubic feet) to heat the home and outside temperature ? (in degree‑days, where a day’s degree‑days are the number of degrees its average temperature falls below 65 ∘F ) over a 23-month period. He then computed the least‑squares regression line for predicting ? from ? and found it to be ?̂ =85+16?. By looking at the equation of the least‑squares regression line, you can see that the correlation between amount of gas used and degree‑days isarrow_forward
- Suppose Tatiyana is interested in the relationship between language ability and time spent reading. She randomly selects a sample of 30 students from the local high school and collects their scores from a language aptitude test. She surveys the sample asking each student how many hours per month he or she spends reading. Using the sample data, Tatiyana produces a scatterplot with reading time on the horizontal axis and language test scores on the vertical axis. She develops a least squares regression equation where ? is the amount of time spent reading during the month and ?̂ is the predicted value of the language test score. ?̂=3.251x+31.237 Compute the value of ?̂ when a student spends 42 hours reading. Give your answer precise to one decimal place. Avoid rounding until the last step. ?̂= ? points Identify all of the true statements regarding the interpretation of ?̂ when ?=42. The value of ?̂ is ? a. the predicted number of students that read for 42 hours. b. the language test…arrow_forwardA study investigated how the content of vitamin A in carrots is affected by the time being cooked. In this example: X represents the amount of time, in minutes, that the carrot slices were cooked Y represents the content of vitamin A (in milligrams) in the carrot slices The least-squares regression equation for this relationship is: Y = 23.4 – 0.55X In this study, which variable is the explanatory variable?arrow_forwardA pediatrician wants to determine the relationship that exists between achild’s height, x, and head circumference, y. She randomly selects 11 children from her practice, measures their heights and head circumferences, and conducts the least-squares regression analysis with the simple linear model using StatCrunch. The output is given below: (a) Write down the equation of the least-squares regression line treating height as the explanatory variable and head circumference as the response variable. (b) Interpret the slope and y-intercept, if appropriate. (c) Use the regression equation to predict the head circumference of a child who is 25 inches tall. Assume that the regression model is applicable.(d) It is observed that one child who is 25 inches tall has a head circumference of 17.5 inches. Is the observed value above or below average among all children with heights of 25 inches?arrow_forward
arrow_back_ios
SEE MORE QUESTIONS
arrow_forward_ios
Recommended textbooks for you
 Functions and Change: A Modeling Approach to Coll...AlgebraISBN:9781337111348Author:Bruce Crauder, Benny Evans, Alan NoellPublisher:Cengage Learning
Functions and Change: A Modeling Approach to Coll...
Algebra
ISBN:9781337111348
Author:Bruce Crauder, Benny Evans, Alan Noell
Publisher:Cengage Learning
Correlation Vs Regression: Difference Between them with definition & Comparison Chart; Author: Key Differences;https://www.youtube.com/watch?v=Ou2QGSJVd0U;License: Standard YouTube License, CC-BY
Correlation and Regression: Concepts with Illustrative examples; Author: LEARN & APPLY : Lean and Six Sigma;https://www.youtube.com/watch?v=xTpHD5WLuoA;License: Standard YouTube License, CC-BY