
Introduction To Statistics And Data Analysis
6th Edition
ISBN: 9781337793612
Author: PECK, Roxy.
Publisher: Cengage Learning,
expand_more
expand_more
format_list_bulleted
Concept explainers
Videos
Textbook Question
Chapter 5.4, Problem 55E
Use the information provided in the previous exercise to answer the following questions.
- a. Here are the values of x′ = log(x) and y′ = log(y):
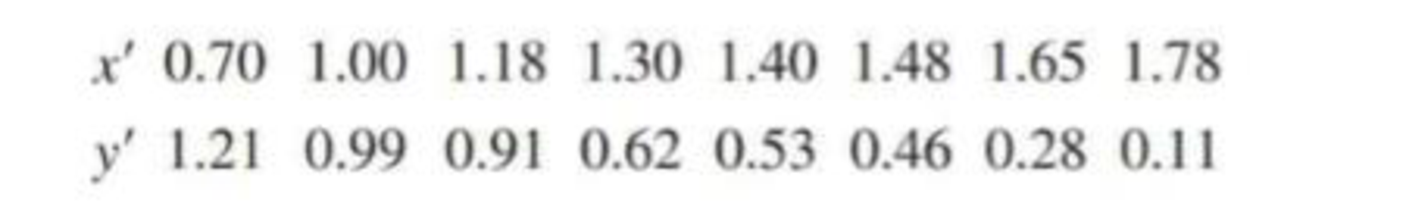
Construct a
- b. Based on the accompanying MINITAB output, does the least-squares line effectively summarize the relationship between y′ and x′?
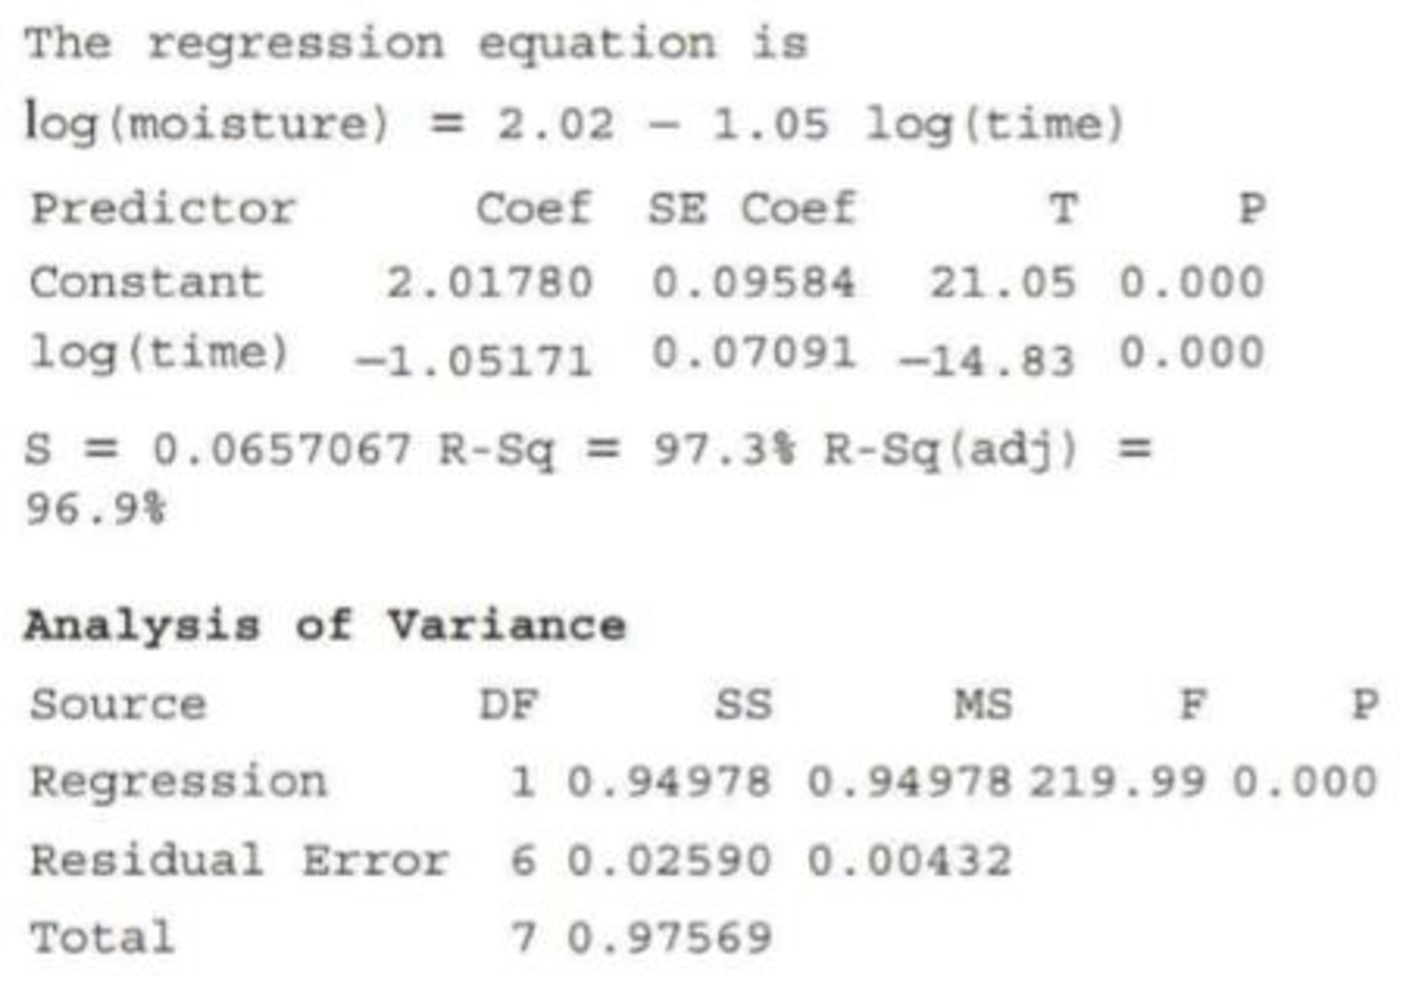
- c. Use the MINITAB output to predict moisture content when frying time is 35 sec.
Expert Solution & Answer

Trending nowThis is a popular solution!

Students have asked these similar questions
Suppose Wesley is a marine biologist who is interested in the relationship between the age and the size of male Dungeness crabs. Wesley collects data on 1,000 crabs and uses the data to develop the following least-squares regression line where ? is the age of the crab in months and ?̂ is the predicted value of ?, the size of the male crab in cm.
?̂=8.2052+0.5693?
What is the value of ?̂ when a male crab is 21.7865 months old? Provide your answer with precision to two decimal place
Suppose Wesley is a marine biologist who is interested in the relationship between the age and the size of male Dungeness crabs. Wesley collects data on 1,000 crabs and uses the data to develop the following least-squares regression line where ?X is the age of the crab in months and ?ˆY^ is the predicted value of ?Y, the size of the male crab in cm.
?ˆ=9.5603+0.3976?Y^=9.5603+0.3976X
What is the value of ?ˆY^ when a male crab is 24.9118 months old? Provide your answer with precision to two decimal places.
Y=
Suppose Wesley is a marine biologist who is interested in the relationship between the age and the size of male Dungeness crabs. Wesley collects data on 1,000 crabs and uses the data to develop the following least-squares regression line where ?X is the age of the crab in months and ?ˆY^ is the predicted value of ?Y, the size of the male crab in cm.
?ˆ=8.2052+0.5693?Y^=8.2052+0.5693X
What is the value of ?ˆY^ when a male crab is 21.7865 months old? Provide your answer with precision to two decimal places.
?ˆ=
Interpret the value of ?ˆ. The value of ?ˆ is
the predicted number of crabs out of the 1,000 crabs collected that will be 21.7865 months old.
the probability that a crab will be 21.7865 months old.
the predicted size of a crab when it is 21.7865 months old.
the predicted incremental increase in size for every increase in age by 21.7865 months.
Chapter 5 Solutions
Introduction To Statistics And Data Analysis
Ch. 5.1 - For each of the scatterplots shown, answer the...Ch. 5.1 - For each of the following pairs of variables,...Ch. 5.1 - For each of the following pairs of variables,...Ch. 5.1 - For each of the following pairs of variables,...Ch. 5.1 - Is the following statement correct? Explain why or...Ch. 5.1 - Draw a scatterplot for which r = 1.Ch. 5.1 - Draw a scatterplot for which r = 1.Ch. 5.1 - Each year J.D. Power and Associates surveys new...Ch. 5.1 - The accompanying data are x = Cost (cents per...Ch. 5.1 - The authors of the paper Flat-footedness Is Not a...
Ch. 5.1 - The paper The Relationship Between Cell Phone Use,...Ch. 5.1 - Data from the U.S. Federal Reserve Board (federal...Ch. 5.1 - The article 115K! The 13 Best Paying U.S....Ch. 5.1 - It may seem odd, but one of the ways biologists...Ch. 5.1 - An auction house released a list of 25 recently...Ch. 5.1 - A sample of automobiles traversing a certain...Ch. 5.2 - Two scatterplots are shown below. Explain why it...Ch. 5.2 - The authors of the paper Statistical Methods for...Ch. 5.2 - The accompanying data are a subset of data from...Ch. 5.2 - The authors of the paper Evaluating Existing...Ch. 5.2 - The authors of the paper referenced in the...Ch. 5.2 - A sample of 548 ethnically diverse students from...Ch. 5.2 - The relationship between hospital patient-to-nurse...Ch. 5.2 - The report Airline Quality Rating 2016...Ch. 5.2 - Acrylamide is a chemical that is sometimes found...Ch. 5.2 - Use the acrylamide data given in the previous...Ch. 5.2 - Studies have shown that people who suffer sudden...Ch. 5.2 - The data given in the previous exercise on x =...Ch. 5.2 - An article on the cost of housing in Califomia...Ch. 5.2 - The following data on sale price, size, and...Ch. 5.2 - Explain why it can be dangerous to use the...Ch. 5.2 - The sales manager of a large company selected a...Ch. 5.2 - Explain why the slope b of the least-squares line...Ch. 5.2 - Prob. 34ECh. 5.3 - Does it pay to stay in school? The report Trends...Ch. 5.3 - The data in the accompanying table is from the...Ch. 5.3 - The paper referenced in the previous exercise also...Ch. 5.3 - Consider the residual plot from the previous...Ch. 5.3 - The report Airline Quality Rating 2016...Ch. 5.3 - Acrylamide is a chemical that is sometimes found...Ch. 5.3 - Consider the scatterplot of acrylamide...Ch. 5.3 - Some types of algae have the potential to cause...Ch. 5.3 - The relationship between x = Total number of...Ch. 5.3 - The residuals from the least-squares line for the...Ch. 5.3 - The first Batman movie was made over 50 years ago...Ch. 5.3 - The article 115K! The 13 Best Paying U.S....Ch. 5.3 - The article Examined Life: What Stanley H. Kaplan...Ch. 5.3 - The accompanying data are a subset of data from...Ch. 5.3 - The article California State Parks Closure List...Ch. 5.3 - The article referenced in the previous exercise...Ch. 5.3 - A study was carried out to investigate the...Ch. 5.3 - Both r2 and se are used to assess the fit of a...Ch. 5.3 - Prob. 53ECh. 5.4 - The following data on x = Frying time (in seconds)...Ch. 5.4 - Use the information provided in the previous...Ch. 5.4 - The paper Aspects of Food Finding by Wintering...Ch. 5.4 - Food intake of grazing animals is limited by the...Ch. 5.4 - A study, described in the paper Prediction of...Ch. 5.4 - Prob. 59ECh. 5.4 - The following table gives the number of heart...Ch. 5.4 - Refer to the heart transplant data given in the...Ch. 5.4 - The paper Population Pressure and Agricultural...Ch. 5.4 - Determining the age of an animal can sometimes be...Ch. 5.5 - The paper How Lead Exposure Relates to Temporal...Ch. 5.5 - The following quote is from the paper Evaluation...Ch. 5 - The accompanying data represent x = Amount of...Ch. 5 - The paper A Cross-National Relationship Between...Ch. 5 - The following data on x = Score on a measure of...Ch. 5 - The paper Effects of Canine Parvovirus (CPV) on...Ch. 5 - The paper Depression, Body Mass Index, and Chronic...Ch. 5 - The paper Aspects of Food Finding by Wintering...Ch. 5 - Data on salmon availability (x) and the percentage...Ch. 5 - No tortilla chip lover likes soggy chips, so it is...Ch. 5 - The article Reduction is Soluble Protein and...Ch. 5 - The following quote is from the paper The Weight...Ch. 5 - An accurate assessment of oxygen consumption...Ch. 5 - Consider the four (x, y) pairs (0, 0), (1, 1), 1,...Ch. 5 - Prob. 1CRECh. 5 - Data from a survey of 1046 adults age 50 and older...Ch. 5 - Prob. 3CRECh. 5 - Prob. 4CRECh. 5 - Prob. 5CRECh. 5 - The amount of money spent each year on science,...Ch. 5 - Below are the data used to construct the time...Ch. 5 - In August 2009, Harris Interactive released the...Ch. 5 - Prob. 9CRECh. 5 - Prob. 10CRECh. 5 - Prob. 11CRECh. 5 - Prob. 12CRECh. 5 - Cost-to-charge ratios (the percentage of the...Ch. 5 - In the article Reproductive Biology of the Aquatic...Ch. 5 - Prob. 15CRECh. 5 - Anabolic steroid abuse has been increasing despite...Ch. 5 - Prob. 81ECh. 5 - Prob. 82ECh. 5 - Prob. 83ECh. 5 - Prob. 84ECh. 5 - Suppose the hypothetical data below are from a...Ch. 5 - Prob. 86E
Knowledge Booster


Learn more about
Need a deep-dive on the concept behind this application? Look no further. Learn more about this topic, statistics and related others by exploring similar questions and additional content below.Similar questions
- Find the equation of the regression line for the following data set. x 1 2 3 y 0 3 4arrow_forwardThe following fictitious table shows kryptonite price, in dollar per gram, t years after 2006. t= Years since 2006 0 1 2 3 4 5 6 7 8 9 10 K= Price 56 51 50 55 58 52 45 43 44 48 51 Make a quartic model of these data. Round the regression parameters to two decimal places.arrow_forwardSuppose Wesley is a marine biologist who is interested in the relationship between the age and the size of male Dungeness crabs. Wesley collects data on 1,000 crabs and uses the data to develop the following least-squares regression line where ? is the age of the crab in months and ?ˆ is the predicted value of ?, the size of the male crab in cm. ?ˆ=8.1312+0.5226? What is the value of ?ˆ when a male crab is 23.0736 months old? Provide your answer with precision to two decimal places. ?ˆ = Interpret the value of ?. The value of ?ˆis the predicted size of a crab when it is 23.0736 months old. the predicted incremental increase in size for every increase in age by 23.0736 months. the predicted number of crabs out of the 1,000 crabs collected that will be 23.0736 months old. the probability that a crab will be 23.0736 months old.arrow_forward
- Suppose Wesley is a marine biologist who is interested in the relationship between the age and the size of male Dungeness crabs. Wesley collects data on 1,000 crabs and uses the data to develop the following least-squares regression line where ?X is the age of the crab in months and ?ˆY^ is the predicted value of ?Y, the size of the male crab in cm. ?ˆ=8.2052+0.5693? What is the value of ?^ when a male crab is 21.7865 months old? Provide your answer with precision to two decimal places. Y^ = Interpret the value of Y^.arrow_forwardSolve the following problems completely. An article in the Journal of Environmental Engineering (1989, Vol. 115(3), reported the results of a study on the occurrence of sodium and chloride in surface streams in central Rhode Island. The following data are chloride concentration y (in milligrams per liter) and roadway area in the watershed x (in percentage). Draw a scatter diagram of the data. Fit the simple linear regression model using the method of least squares. Find an estimate of σ2. Estimate the mean chloride concentration for a watershed that has 1% roadway area. Find the fitted value corresponding to x = 0.47 and the associated residual. Test the hypothesis H0: β1 = 0 versus H1: β1 ≠ 0 using the analysis of variance procedure with α = 0.01. Find a 99% confidence interval of Mean chloride concentration when roadway area x = 1.0% Find a 99% prediction interval on chloride concentration when roadway area x = 1.0%. Plot the residuals versus ŷ and versus x. Interpret these plots.…arrow_forwardThe following table shows the length, in centimeters, of the humerus and the total wingspan, in centimeters, of several pterosaurs, which are extinct flying reptiles. (A graphing calculator is recommended.) (a) Find the equation of the least-squares regression line for the data. (Where × is the independent variable.) Round constants to the nearest hundredth. y= ? (b) Use the equation from part (a) to determine, to the nearest centimeter, the projected wingspan of a pterosaur if its humerus is 52 centimeters. ? cmarrow_forward
- The following table lists the birth weights (in pounds), x, and the lengths (in inches), y, for a set of newborn babies at a local hospital. Birth Weights and Lengths Birth Weight (in Pounds), x 6 11 5 3 9 12 11 11 4 10 Length (in Inches), y 16 18 15 15 20 20 19 20 16 21 Step 1 of 2 : Find an equation of the least-squares regression line. Round your answer to three decimal places, if necessary.arrow_forwardThe following information relates to BCD Co. Month Usage Cost Jan. 600 P750 Feb. 650 775 Mar. 420 550 Apr. 500 650 May 450 570Using the least squares regression, what is the fixed cost element (to the nearest whole peso)?arrow_forwardThe following Minitab display gives information regarding the relationship between the body weight of a child (in kilograms) and the metabolic rate of the child (in 100 kcal/ 24 hr). Predictor Coef SE Coef T P Constant 0.8462 0.4148 2.06 0.84 Weight 0.40592 0.02978 13.52 0.000 S = 0.517508 R-Sq = 95.6% (a) Write out the least-squares equation. = + x (b) For each 1 kilogram increase in weight, how much does the metabolic rate of a child increase? (Use 5 decimal places.)(c) What is the value of the correlation coefficient r? (Use 3 decimal places.)arrow_forward
arrow_back_ios
arrow_forward_ios
Recommended textbooks for you
 Functions and Change: A Modeling Approach to Coll...AlgebraISBN:9781337111348Author:Bruce Crauder, Benny Evans, Alan NoellPublisher:Cengage Learning
Functions and Change: A Modeling Approach to Coll...
Algebra
ISBN:9781337111348
Author:Bruce Crauder, Benny Evans, Alan Noell
Publisher:Cengage Learning
Correlation Vs Regression: Difference Between them with definition & Comparison Chart; Author: Key Differences;https://www.youtube.com/watch?v=Ou2QGSJVd0U;License: Standard YouTube License, CC-BY
Correlation and Regression: Concepts with Illustrative examples; Author: LEARN & APPLY : Lean and Six Sigma;https://www.youtube.com/watch?v=xTpHD5WLuoA;License: Standard YouTube License, CC-BY