
Concept explainers
Videos
The residuals from the least-squares line for the data given in the previous exercise are shown in the accompanying table.
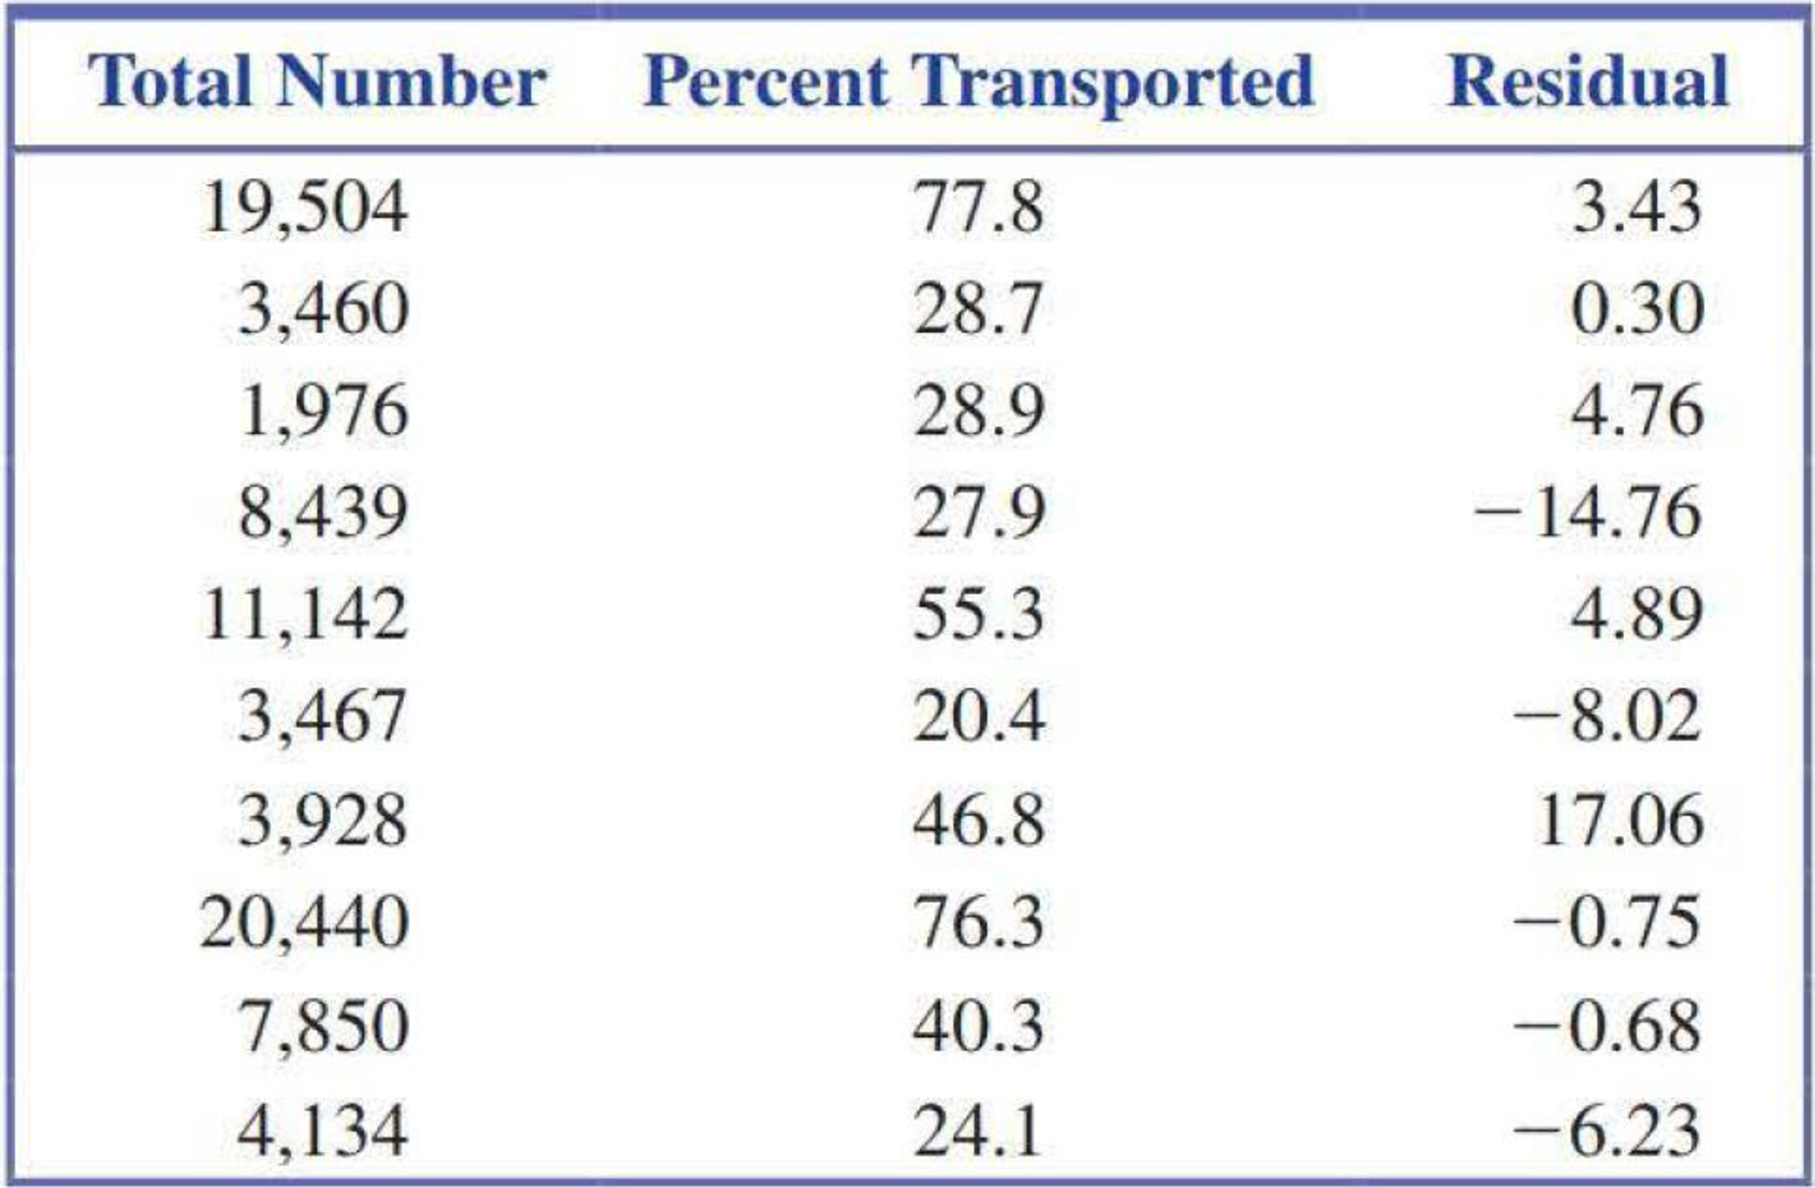
- a. The observation (3928, 46.8) has a large residual. Is this data point also an influential observation?
- b. The two points with unusually large x values (19,504 and 20,440) were not thought to be influential observations even though they are far removed in the x direction from the rest of the points in the
scatterplot . Explain why these two points are not influential. - c. Partial Minitab output resulting from fitting the least-squares line is shown here. What is the value of se? Write a sentence interpreting this value.
The regression equation is
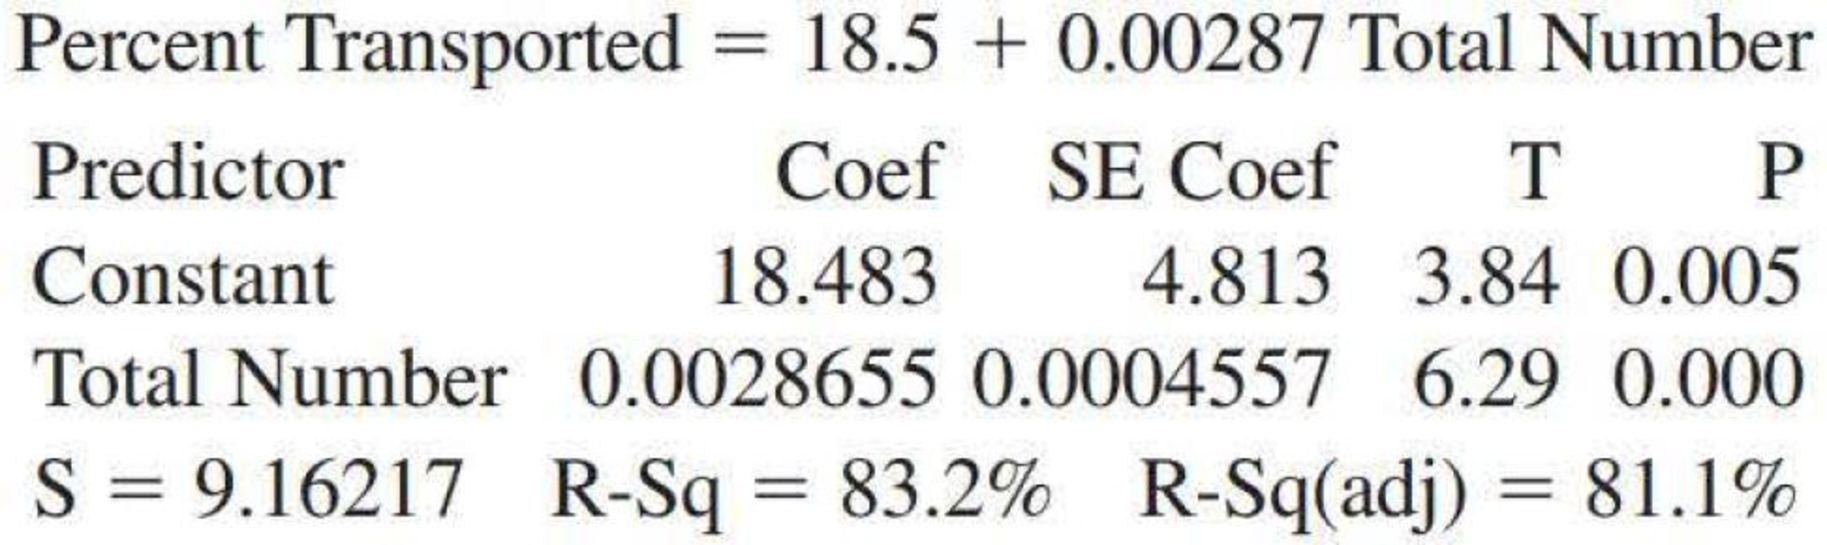
- d. What is the value of r2 for this data set (see Minitab output in Part (c))? Is the value of r2 large or small? Write a sentence interpreting the value of r2.
5.43 ● The relationship between x = Total number of salmon in a creek and y = Percentage of salmon killed by bears that were transported away from the stream prior to the bear eating the salmon was examined in the paper “Transportation of Pacific Salmon Carcasses from Streams to Riparian Forests by Bears” (Canadian Journal of Zoology [2009]: 195–203).
Data for the 10 years from 1999 to 2008 is given in the accompanying table.
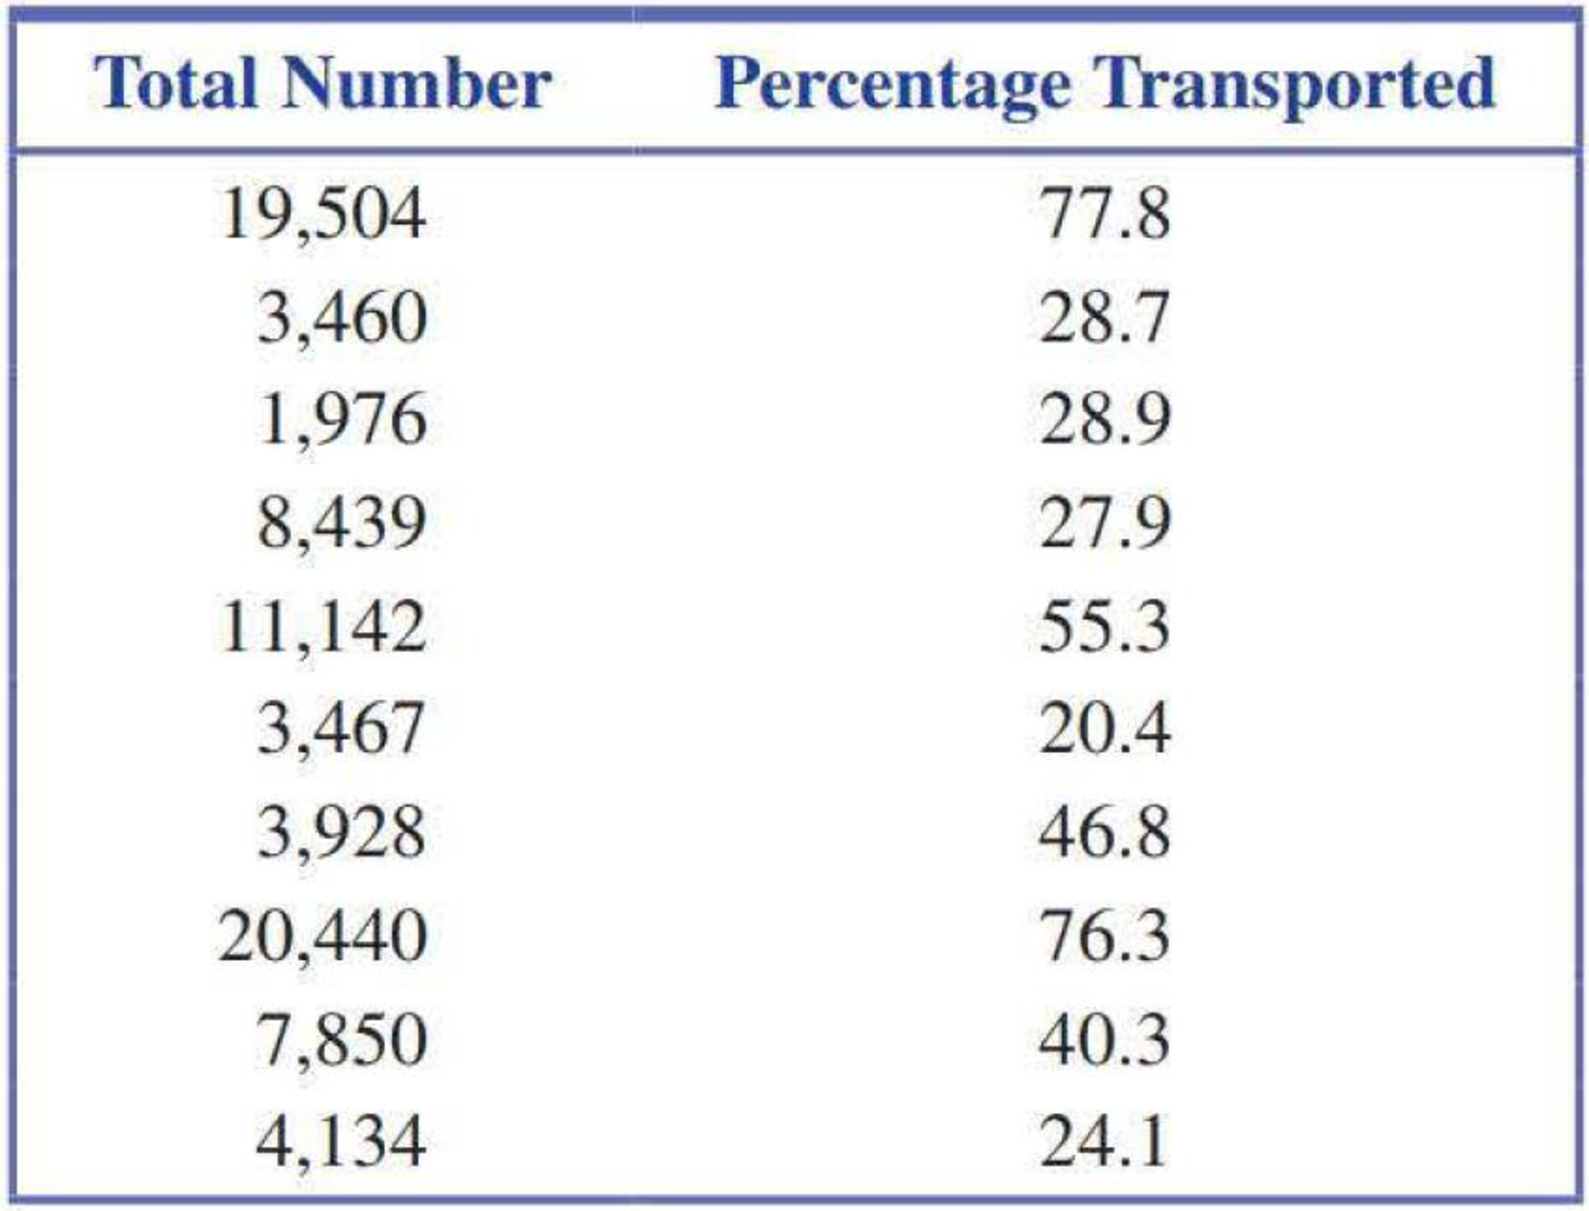
- a. Construct a scatterplot of the data.
- b. Does there appear to be a relationship between the total number of salmon in the stream and the percentage of salmon killed by bears that are transported away from the stream?
- c. Find the equation of the least-squares line. Draw the least-squares line on the scatterplot from Part (a).

Trending nowThis is a popular solution!

Chapter 5 Solutions
Introduction To Statistics And Data Analysis
Additional Math Textbook Solutions
Fundamentals of Statistics (5th Edition)
Essentials of Statistics (6th Edition)
Elementary Statistics Using The Ti-83/84 Plus Calculator, Books A La Carte Edition (5th Edition)
Business Statistics: A First Course (8th Edition)
The Practice of Statistics for AP - 4th Edition
Statistical Reasoning for Everyday Life (5th Edition)


- Suppose Wesley is a marine biologist who is interested in the relationship between the age and the size of male Dungeness crabs. Wesley collects data on 1,000 crabs and uses the data to develop the following least-squares regression line where ? is the age of the crab in months and ?ˆ is the predicted value of ?, the size of the male crab in cm. ?ˆ=8.1312+0.5226? What is the value of ?ˆ when a male crab is 23.0736 months old? Provide your answer with precision to two decimal places. ?ˆ = Interpret the value of ?. The value of ?ˆis the predicted size of a crab when it is 23.0736 months old. the predicted incremental increase in size for every increase in age by 23.0736 months. the predicted number of crabs out of the 1,000 crabs collected that will be 23.0736 months old. the probability that a crab will be 23.0736 months old.arrow_forwardA researcher collected data on the cholesterol level, CC, and the age, AA, of 24 people selected at random. Using the data, the researcher calculated the least-squares regression line to be Cˆ=182+2.2AC^=182+2.2A and the standard error of the slope to be 0.38. If the conditions for inference are met, which of the following is closest to the value of the test statistic to test the hypotheses H0:β=0H0:β=0 versus Ha:β≠0Ha:β≠0 ?arrow_forwardThe following table is an abbreviated life expectancy table for males. current age, x 0 20 40 60 80 life expectancy, y 76.6 years 78.9 years 80.5 years 81.7 years 82.7 years a. Find the straight line that provides the best least-squares fit for these data.arrow_forward
- The following data show the amount spent on office-building construction (in thousands) for a particular county during a 66-month period. Office Construction Month Apr May Jun Jul Aug Sep Amount (in thousands) $15$15 $25$25 $42$42 $51$51 $60$60 $74$74 Find the least‑squares regression line for the data. (Let x=1x=1 correspond to January, x=2x=2 to February, etc.) Round the coefficients to three decimal places. Estimate the amount spent on construction in October. Express your answer in thousands of dollars and round to three decimal places.arrow_forwardThe following are the scores that 12 students obtainedon the midterm and final examinations in a course instatistics:Midterm examination Final examinationx y71 8349 6280 7673 7793 8985 7458 4882 7864 7632 5187 7380 89 (a) Find the equation of the least squares line that willenable us to predict a student’s final examination score inthis course on the basis of his or her score on the midtermexamination.(b) Predict the final examination score of a student whoreceived an 84 on the midterm examination.arrow_forwardA security firm wants to renew the uniforms used by his personnel. It starts by collecting data on their height and weight. The following data was collected from the 19 employees Height (cm) Weight (kg) 168 72 175 88 167 84 171 87 161 67 164 55 177 82 170 60 167 60 184 77 183 98 163 53 186 77 165 64 173 89 161 65 179 77 169 64 174 87 a). Construct an equation to relate these variables, using the least-squares method to determine the regression coefficients, b0 and b1. b). Interpret the meaning of b0 and b1 in this problem. c) determine the coefficient of determination, r2 and interpret its meaning.arrow_forward
- The following information pertains to a simple least squares regression for DEF Corporation: Mean value of the dependent variable 30Mean value of the independent variable 8Coefficient of the independent variable 3Number of observations 12 What is the "a" value for the leasts-quares regression model? a. 60b. 30c. 6d. 0arrow_forwardA study of 25 online jewelry retailers was done to find the statistical relationship between the price yyin dollars of a diamond ring and the weight xxin carats of the diamond. Based on this data the following least-squares regression line was found: y^=−6047.75+11975.14xy^=−6047.75+11975.14x One online retailer sells a 3.00 carat diamond ring for 28,999 dollars. What is the residual (error) for the predicted price of a 3.00 carat diamond ring? Give your answer to two decimal places.arrow_forwardThe following Minitab display gives information regarding the relationship between the body weight of a child (in kilograms) and the metabolic rate of the child (in 100 kcal/ 24 hr). Predictor Coef SE Coef T P Constant 0.8462 0.4148 2.06 0.84 Weight 0.40592 0.02978 13.52 0.000 S = 0.517508 R-Sq = 95.6% (a) Write out the least-squares equation. = + x (b) For each 1 kilogram increase in weight, how much does the metabolic rate of a child increase? (Use 5 decimal places.)(c) What is the value of the correlation coefficient r? (Use 3 decimal places.)arrow_forward
 Linear Algebra: A Modern IntroductionAlgebraISBN:9781285463247Author:David PoolePublisher:Cengage Learning
 Glencoe Algebra 1, Student Edition, 9780079039897...AlgebraISBN:9780079039897Author:CarterPublisher:McGraw Hill