
Videos
A study is being planned to assess whether a topical antiallergic eye drop is effective in preventing the signs and symptoms of allergic conjunctivitis. In a pilot study, at an initial visit, participants are given an allergen challenge; that is, they are subjected to a substance that provokes allergy signs (e.g., cat dander) and their redness score is noted 10 minutes after the allergen challenge (visit 1 score). At a follow-up visit, the same procedure is followed, except that participants are given an active eye drop in one eye and the placebo in the fellow eye 3 hours before the challenge; a visit 2 score is obtained 10 minutes after the challenge. The data collected are shown in Table 8.26.
Table 8.26 Effect of an eye drop in reducing ocular redness among participants subjected to an allergen challenge
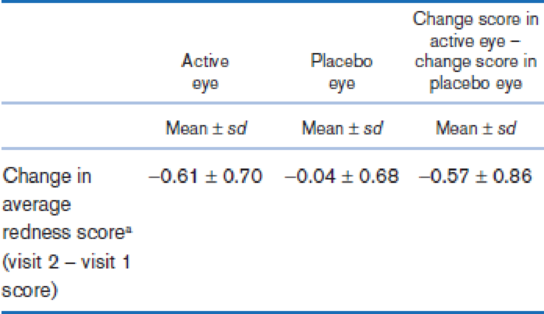
aThe redness score
Suppose 60 participants are enrolled in the main study. How much power would the study have to detect a 0.5-unit mean difference if a two-sided test is used with a significance level of .05?
Want to see the full answer?
Check out a sample textbook solution
Chapter 8 Solutions
Fundamentals of Biostatistics


- The Diabetes Control and Complications trial research group, randomly assigned volunteers with type 1 (insulin-dependent) diabetes mellitus, but without retinopathy, either to a conventional treatment or to a more intensive treatment aimed at maintaining normal blood glucose levels. The volunteers' health was monitored closely for approximately six years. By the end of the study, 91 patients out of 378 in the conventional treatment group had developed retinopathy, whereas 23 out of 348 in the intensive treatment group had developed retinopathy. Test whether the rates of retinopathy differed significantly between the two treatment groups, if they did, which rate was significantly lower. 1. Provide the null hypothesis 2. Provide the alternative hypotheses 3. calculate the appropriate test statistic. Show all work 4. Identify the p-value for that test statistic 5. Using the p-value method and an alpha level of 0.02 state what your conclusions are regarding the null hypothesis, and…arrow_forwardThe Diabetes Control and Complications trial research group, randomly assigned volunteers with type 1 (insulin-dependent) diabetes mellitus, but without retinopathy, either to a conventional treatment or to a more intensive treatment aimed at maintaining normal blood glucose levels. The volunteers' health was monitored closely for approximately six years. By the end of the study, 91 patients out of 378 in the conventional treatment group had developed retinopathy, whereas 23 out of 348 in the intensive treatment group had developed retinopathy. Test wether the rates of retionpathy differed significantly betweenthe two treatment groups, if they did, which rate was significantly lower. 1. Provide the null hypothesis 2. Provide the alternative hypotheses 3. calculate the appropriate test statistic. Show all work 4. Indentify the p-value for that test statistic 5. Using the p-vlaue method and an alpha level of 0.02 state what your conclusions is regarding the null hypothesis, and…arrow_forwardChocolate contains caffeine and an endogenous cannabinoid, as well as a chemical thatmodulates serotonin production; but is it an aphrodisiac, as the Mayans and Aztecs believed?Suppose you conduct a study which measures sex drive in a group of 20 women, after eating 8ounces of chocolate. Given that you have available data from the Kinsey Institute (IndianaUniversity) about the general sex drive for women of the same demographic as in your study, youdecide to compare your group to this population estimate.If testing hypotheses about the effects of chocolate on sex drive, it would be most appropriate tocalculate a ...1)Paired sampled t2)Z-test3)Independent-samples t-test 4)One- sample t-testarrow_forward
- In a recent study of a random sample of 113 people, 92 reported dreaming in color. In the 1940’s, the proportion of people who reported dreaming in color was 29%. Is there evidence to show that the proportion of people who dream in color is different than the proportion in the 1940’s? What is the critical value for this hypothesis test? In a recent study of a random sample of 113 people, 92 reported dreaming in color. In the 1940’s, the proportion of people who reported dreaming in color was 29%. Is there evidence to show that the proportion of people who dream in color is different than the proportion in the 1940’s? What is the critical value for this hypothesis test? \pm1.96±1.96 \pm1.645±1.645 \pm2.575±2.575 \pm2.05±2.05 \pm2.33±2.33arrow_forwardIn 1992, the U.S. Public Health Service and the Centres for Disease Control and Prevention recommended that all women of childbearing age consume 400mg of folic acid daily to reduce the risk of having a pregnancy that is affected by a neural tube defect such as spina bifida or anencephaly. In a study by Stepanuk et al. (A-3), 693 pregnant women called a teratology information service about their use of folic acid supplementation. The researchers wished to determine if preconceptional use of folic acid and race are independent. The data appear in Table below: Total Preconceptional Use of Folic Acid Race No Yes 559 299 260 White 56 41 15 Black 21 14 7 Other 636 354 282 Total Test the hypothesis that there is no association between the usage of folic acid and race with 5% significant level and using SPSS (Choose only 4 correct answers from the following statements): 1. The null and alternative hypothesis are: H0: The two variables are dependent. H1: The two…arrow_forwardThe National Institute of Mental Health published an article stating that in any two-year period, approximately 10.5percent of American adults suffer from depression or a depressive illness. Suppose that in a survey of 150 people in a certain town, eight of them suffered from depression or a depressive illness. If you were conducting a hypothesis test to determine if the true proportion of people in that town suffering from depression or a depressive illness is lower than the percent in the general adult American population, what would the null and alternative hypotheses be?arrow_forward
- The following table shows the results of a screening test hypothesized to detect persons at risk for side effects of a new cosmetic surgery. Compute the specificity of the test. Side effects present Side effects absent Screen positive 12 6 Screen negative 85 204arrow_forwardA large research project showed that in a sample of 750 adults, 60 of them experienced a midlife crisis . Use this data to test the claim that the percentage of adults who experienced midlife crisis is less than 10%. Use (alpha)= 0.05 .arrow_forwardSuppose a researcher is interested inthe effectiveness in a new childhood exercise program implemented in a SRS of schools across a particular county. In order to test the hypothesis that the new program decreases BMI (Kg/m2), the researcher takes a SRS of children from schools where the program is employed and a SRS from schools that do not employ the program and compares the results. Assume the following table represents the SRSs of students and their BMIs. Student intervention group BMI (kg/m2) Student control group BMI (kg/m2) A 18.6 A 21.6 B 18.2 B 18.9 C 19.5 C 19.4 D 18.9 D 22.6 E 24.1 F 23.6 A) Assuming that all the necessary conditions are met (normality, independence, etc.) carry out the appropriate statistical test to determine if the new exercise program is effective. Use an alpha level of 0.05. Do not assume equal variances.B) Construct a 95% confidence interval about your estimate for the average difference in BMI between the groups.arrow_forward
- A study of 6600 men found that those who consumed a moderate amount of alcohol (one drink or less per night ) have lower mortality(on the average ) than Thoose who drink none is the is this good evidence that drinking a moderate amount causes lower mortality? A) yes because the study is an experiment B) no becuase who drink a moderate amount may differ from nodeinkers in other ways such as income and exercise that affect mortality c) no because we can't generalize from 6600 people to the millions of adults in the country D) yes because the sample is so large that the margin of error will be quite smallarrow_forwardNoting the paucity of information on the effect of estrogen on platelet membrane fatty acid composition, Ranganath et al. (A-48) conducted a study to examine the possibility that changes may be present in postmenopausal women and that these may be reversible with estrogen treatment. The 31 women recruited for the study had not menstruated for at least 3 months or had symptoms of the menopause. No woman was on any form of hormone replacement therapy (HRT) at the time she was recruited. Table 5 shows the platelet membrane linoleic acid values before and after a period of HRT. Does the data follow normal distribution?arrow_forwardNoting the paucity of information on the effect of estrogen on platelet membrane fatty acid composition, Ranganath et al. (A-48) conducted a study to examine the possibility that changes may be present in postmenopausal women and that these may be reversible with estrogen treatment. The 31 women recruited for the study had not menstruated for at least 3 months or had symptoms of the menopause. No woman was on any form of hormone replacement therapy (HRT) at the time she was recruited. Table 5 shows the platelet membrane linoleic acid values before and after a period of HRT. What is the lower limit of CI? 4 decimal placesarrow_forward
 Holt Mcdougal Larson Pre-algebra: Student Edition...AlgebraISBN:9780547587776Author:HOLT MCDOUGALPublisher:HOLT MCDOUGAL
 Glencoe Algebra 1, Student Edition, 9780079039897...AlgebraISBN:9780079039897Author:CarterPublisher:McGraw Hill