
Videos
study was recently reported comparing the effects of different dietary patterns on blood pressure within an 8-week follow-up period [16]. Subjects were randomized to three groups: A, a control diet group, N = 154; B, a fruits-andvegetables diet group, N = 154; C, a combination-diet group consisting of a diet rich in fruits, vegetables, and lowfat dairy products and with reduced saturated and total fat, N = 151. The results reported for systolic blood pressure (SBP) are shown in Table 8.29.
Table 8.29 Effects of dietary pattern on change in SBP
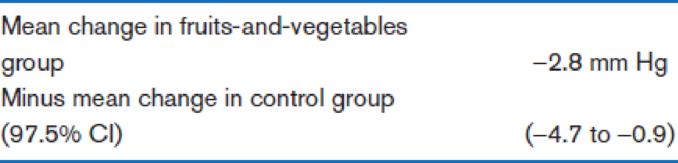
Suppose we assume that the standard deviation of change in blood pressure is the same in each group and is known without error. Compute the exact p-value from the information provided.
Want to see the full answer?
Check out a sample textbook solution
Chapter 8 Solutions
Fundamentals of Biostatistics


- An experiment was conducted for better understanding of the effectiveness of a particular type of drug for reducing bad cholesterol (LDL) level. The purpose of the experiment was to determine whether different dosages used have significant different outcomes in average LDL reduction. Twenty subjects with LDL at around 250 to 300 mg/dL had participated in the study and were randomly divided into four groups. Each group was given a specific level of dosage of the drug each day for one month, with a control group that only provided with placebo. The reduction in LDL was recorded and showed in the following table. Positive number indicates reduction and negative numbers indicates increasing in DLD. Use statistical software to analyze the data and answer the following question. Control Light Dosage Level Medium Dosage Level Heavy Dosage Level 7 25 73 81 -3 17 60 71 6 22 55 79 5 21 41 60 15 12 36 85 Perform a One-way…arrow_forwardThe May 10, 2007 issue of The New England Journal of Medicine describes two large randomized, placebo-controlled trials of a vaccine for HPV-related cancer. HPV is human papillomavirus, the most common form of sexually transmitted infection. For the group of people who received the vaccine, the HPV-related cancer rate was much lower than for those who received a placebo. Which best describes the goal of this study?arrow_forwardThe results of a multicenter clinical trial to determine the safety and efficacy of the pancreatic lipase inhibitor, Xenical, was reported (Ingersoll, 1997). Xenical is used to block the absorption of dietary fat. The article reported that more than 4000 patients in the U.S. and Europe were randomized to receive Xenical or a placebo in a parallel groups study. After one year, 57% of those receiving Xenical had lost at least 5% of their body weight, as opposed to 31% of those receiving a placebo. Assume that exactly 4000 patients were in the study, and that 2000 were randomized to receive a placebo and 2000 received Xenical. Please Compute a 95% confidence interval for the “relative risk” of losing at least 5% of body weight for those receiving Xenical relative to those receiving placebo. Can the drug be considered effective?arrow_forward
- In randomized, double-blind clinical trials of a new vaccine, rats were randomly divided into two groups. Subjects in group 1 received the new vaccine while subjects in group 2 received a control vaccine. After the second dose, 111 of 670 subjects in the experimental group (group 1) experienced drowsiness as a side effect. After the second dose, 68 of 551 of the subjects in the control group (group 2) experienced drowsiness as a side effect. Does the evidence suggest that a higher proportion of subjects in group 1 experienced drowsiness as a side effect than subjects in group 2 at the α=0.05 level of significance? a. Find the test statistic for this hypothesis test. Round to two decimal places as needed.arrow_forwardIn a randomized double-blind clinical trials of a new vaccine children were randomly divided into two groups subjects in group one received the new vaccine while subjects in group 2 received a control vaccine after the second dose 112 of 690 subjects in the experimental group 1 experienced drowsiness as a side effect after the second dose 69 of 571 of the subjects in the control group 2 experienced drowsiness as a side effect does the evidence suggest that a higher proportion of subjects in group 1 experience drowsiness as a side effect than subjects in group 2 at 0.05 level of significance? Determine the null and alternative hypothesis? find the test statistic for this hypothesis test? determine the P value for this hypothesis test? do we reject or not reject the null hypothesis and why? State your conclusion?arrow_forwardIn randomized, double-blind clinical trials of a new vaccine, infants were randomly divided into two groups. Subjects in group 1 received the new vaccine while subjects in group 2 received a control vaccine. After the second dose, 126 of 387 subjects in the experimental group (group 1) experienced drowsiness as a side effect. After the second dose, 158 of 574 of the subjects in the control group (group 2) experienced drowsiness as a side effect. Does the evidence suggest that a higher proportion of subjects in group 1 experienced drowsiness as a side effect than subjects in group 2 at the α=0.01 level of significance? Verify the model requirements. Select all that apply. A. The sample size is less than 5% of the population size for each sample. B. n1p11−p1≥10 and n2p21−p2≥10 C. The samples are dependent. D. The sample size is more than 5% of the population size for each sample. E. The samples are independent. F. The data come…arrow_forward
- The Joint Commission on Accreditation of Healthcare Organizations mandated that hospitals ban smoking by 1994. To study the effects of this ban on smoking behaviors, subjects were randomly selected from two different populations: those from hospitals with the ban and those from hospitals without the ban. Investigators were interested in determining if this smoking ban had any impact on the proportion of smokers employed at each hospital that then quit smoking. Among 843 smoking employees of hospitals with the smoking ban, 56 quit smoking during the study period. Among 703 smoking employees from workplaces without the smoking ban, 27 quit smoking during the study period. Below is the Stata output that was run to determine if there was a statistically significant difference between these two proportions at the α=0.05 level. A. What is the estimate of the proportion of smokers from the hospitals that implemented the ban that quit smoking (the blank labeled "C" in the above output)?…arrow_forwardA prospective study on the relationship between aspirin use and heart attacks by the Physicians’ Health Study Research Group at Harvard Medical School is presented below. The Physicians’ Health Study was a 5-year randomized study of whether regular aspirin intake reduces risk of myocardial infarction or heart attack. Every other day, physicians participating in the study took either one aspirin tablet or a placebo. The study was blind ---those in the study did not know whether they were taking aspirin or a placebo. Of the 11,034 physicians taking a placebo, 189 suffered heart attacks over the course of the study, whereas of the 11,037 taking aspirin, 104 had heart attacks. Can we say that the intake of aspirin appears to diminish the risk of myocardial infarction? LOOK AT THE IMAGE (table) THAT I ATTACHED Let patients taking placebo be the first group and those taking aspirin in the second group. Calculate the following and make an interpretation: confidence interval for risk…arrow_forwardIn a study of smokers who tried to quit smoking with nicotine patch therapy, 39 were smoking one year after the treatment, and 32 were not smoking one year after the treatment (based on data from “High Dose Nicotine Patch Therapy,” by Dale et al., Journal of the American Medical Association, Vol. 274, No. 17). We want to use a 0.05 significance level to test the claim that among smokers who try to quit with nicotine patch therapy, the majority are smoking a year after the treatment. Describe a type 1 error for this test.arrow_forward
- In a study of smokers who tried to quit smoking with nicotine patch therapy, 39 were smoking one year after the treatment, and 32 were not smoking one year after the treatment (based on data from “High Dose Nicotine Patch Therapy,” by Dale et al., Journal of the American Medical Association, Vol. 274, No. 17). We want to use a 0.05 significance level to test the claim that among smokers who try to quit with nicotine patch therapy, the majority are smoking a year after the treatment. What do you conclude? (Be sure to address the original claim that among smokers who try to quit with nicotine patch therapy, the majority are smoking a year after the treatment.arrow_forwardIn a study of smokers who tried to quit smoking with nicotine patch therapy, 39 were smoking one year after the treatment, and 32 were not smoking one year after the treatment (based on data from “High Dose Nicotine Patch Therapy,” by Dale et al., Journal of the American Medical Association, Vol. 274, No. 17). We want to use a 0.05 significance level to test the claim that among smokers who try to quit with nicotine patch therapy, the majority are smoking a year after the treatment. What is the value of the standard score for the sample proportion?arrow_forwardIn a study of smokers who tried to quit smoking with nicotine patch therapy, 39 were smoking one year after the treatment, and 32 were not smoking one year after the treatment (based on data from “High Dose Nicotine Patch Therapy,” by Dale et al., Journal of the American Medical Association, Vol. 274, No. 17). We want to use a 0.05 significance level to test the claim that among smokers who try to quit with nicotine patch therapy, the majority are smoking a year after the treatment. What is the value of the sample score for the standard production?arrow_forward
 MATLAB: An Introduction with ApplicationsStatisticsISBN:9781119256830Author:Amos GilatPublisher:John Wiley & Sons Inc
 Probability and Statistics for Engineering and th...StatisticsISBN:9781305251809Author:Jay L. DevorePublisher:Cengage Learning
 Statistics for The Behavioral Sciences (MindTap C...StatisticsISBN:9781305504912Author:Frederick J Gravetter, Larry B. WallnauPublisher:Cengage Learning
 Elementary Statistics: Picturing the World (7th E...StatisticsISBN:9780134683416Author:Ron Larson, Betsy FarberPublisher:PEARSON
 The Basic Practice of StatisticsStatisticsISBN:9781319042578Author:David S. Moore, William I. Notz, Michael A. FlignerPublisher:W. H. Freeman
 Introduction to the Practice of StatisticsStatisticsISBN:9781319013387Author:David S. Moore, George P. McCabe, Bruce A. CraigPublisher:W. H. Freeman