
Concept explainers
Videos
A study was conducted of genetic and environmental influences on cholesterol levels. The data set used for the study were obtained from a twin registry in Sweden [10]. Specifically, four populations of adult twins were studied: (1) monozygotic (MZ) twins reared apart, (2) MZ twins reared together, (3) dizygotic (DZ) twins reared apart, and (4) DZ twins reared together. One issue is whether it is necessary to correct for gender before performing more complex genetic analyses. The data in Table 8.17 were presented for total cholesterol levels for MZ twins reared apart, by gender.
Table 8.17 Comparison of mean total cholesterol for MZ twins reared apart, by gender
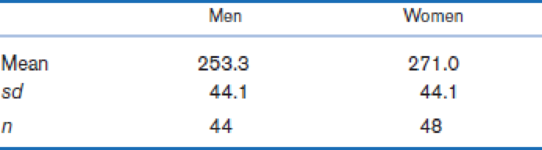
Note: n = number of people (e.g., for males, 22 pairs of twins = 44 people) the cholesterol levels within each sample consist of independent observation.
Suppose we want to use the procedure in Problem 8.49 using a two-sided test. State the hypotheses being tested, and implement the method. Report a p-value.
8.49 If we assume (a) serum cholesterol is
Want to see the full answer?
Check out a sample textbook solution
Chapter 8 Solutions
Fundamentals of Biostatistics


- In three randomly selected groups of patients (a,b,C) and normal healthy individuals (control group), Serum total Protein (STP) values were measured and their differences, if any, were investigated compared to the control group. The following table shows the STP values measured in 5 randomly selected individuals for each group for this purpose. Accordingly, do the STP values of these individuals differ significantly according to the groups? If there are differences between the groups, find out which groups are different compared to the normal healthy group (control group). A B C NORMAL GROUP 1 8.5 11.7 14.8 6.4 2 9.7 12.8 17.9 6.5 3 12.1 14.9 21.6 6.7 4 9.6 16.3 15 5.9 5 9.4 15.4 12 6arrow_forwardThe Joint Commission on Accreditation of Healthcare Organizations mandated that hospitals ban smoking by 1994. To study the effects of this ban on smoking behaviors, subjects were randomly selected from two different populations: those from hospitals with the ban and those from hospitals without the ban. Investigators were interested in determining if this smoking ban had any impact on the proportion of smokers employed at each hospital that then quit smoking. Let px be the proportion of smokers from hospitals that implemented the ban who quit smoking during the study period. Let py be the proportions of smokers from hospitals without the ban who quit smoking during the study period. Please select the appropriate hypotheses. H0: px = 0.50 HA: px ≠ 0.50 H0: px-py ≥ 0 HA: px-py H0: px-py ≤ 0 HA: px-py > 0 H0: px-py = 0 HA: px-py ≠ 0arrow_forwardIn a small study, a local community college investigated different indicators of college success. They found that: 0.36 of enrolled students had a full time job, 0.75 of enrolled students were enrolled full-time, and 0.19 of students enrolled full-tme also had a full-time job. According to the results of this study, are the outcomes "have a full-time job" and "enrolled full-time independent?arrow_forward
- To examine adolescent substance abuse, Li, Pentz, and Chou (2002) surveyed 1,807 middle school students from 57 schools. The results showed that a greater risk of adolescent substance abuse was associated with increasing numbers of parents and friends who were sub- stance abusers. However, friends’ use did not affect adolescent substance abuse when parents were nonusers. Is this an example of a research design?arrow_forwardThe Joint Commission on Accreditation of Healthcare Organizations mandated that hospitals ban smoking by 1994. To study the effects of this ban on smoking behaviors, subjects were randomly selected from two different populations: those from hospitals with the ban and those from hospitals without the ban. Investigators were interested in determining if this smoking ban had any impact on the proportion of smokers employed at each hospital that then quit smoking. Among 843 smoking employees of hospitals with the smoking ban, 56 quit smoking during the study period. Among 703 smoking employees from workplaces without the smoking ban, 27 quit smoking during the study period. Below is the Stata output that was run to determine if there was a statistically significant difference between these two proportions at the α=0.05 level. A. What is the estimate of the proportion of smokers from the hospitals that implemented the ban that quit smoking (the blank labeled "C" in the above output)?…arrow_forwardChocolate contains caffeine and an endogenous cannabinoid, as well as a chemical thatmodulates serotonin production; but is it an aphrodisiac, as the Mayans and Aztecs believed?Suppose you conduct a study which measures sex drive in a group of 20 women, after eating 8ounces of chocolate. Given that you have available data from the Kinsey Institute (IndianaUniversity) about the general sex drive for women of the same demographic as in your study, youdecide to compare your group to this population estimate.If testing hypotheses about the effects of chocolate on sex drive, it would be most appropriate tocalculate a ...1)Paired sampled t2)Z-test3)Independent-samples t-test 4)One- sample t-testarrow_forward
- Based on a survey of 12,344 U.S. college students and 6,729 Canadian college students, Kuo, Adlaf, Lee, Gliksman, Demers, and Wechsler (2002) report that alcohol use is more common among Canadian than U.S. students, but heavy drinking (five or more drinks in a row for males, four or more for females) is significantly higher among U.S. students than Canadian students. Is this an example of a survey research design?arrow_forwardA 1980 study investigated the relationship between the use of OCs and the development of endometrial cancer. The researchers found that of 117 endometrial-cancer patients, 6 had used the OC Oracon at some time in their lives, whereas 8 of the 395 controls had used this agent. Test for an association between the use of Oracon and the incidence of endometrial cancer, using a two-tailed test.arrow_forwardAn experiment to determine if a migraine medication decreases a person's average number of monthly migraines is performed on 400 people who report they have several migraines a month. Researchers randomly assigned 200 people to the treatment group and 200 people to the control group. After the study, the researchers determined that 48 of the subjects in the treatment group and 28 of the subjects in the control group average fewer migraines per month. The data from the two groups are resampled 150 times, and the table shows the distribution of the differences of the proportions for the reconfigured treatment and control groups.arrow_forward
- Pillman et al. (A-11) studied patients with acute brief episodes of psychoses. The researchers classified subjects into four personality types: obsessiod, asthenic=low self-confident, asthenic=high self-confident, nervous=tense, and undeterminable. The table below cross-classifies these personality types with three groups of subjects—those with acute and transient psychotic disorders (ATPD), those with “positive” schizophrenia (PS), and those with bipolar schizo-affective disorder (BSAD): REVIEW QUESTIONS AND EXERCISES 87 Personality Type Obsessoid (O)Asthenic=low Self-confident (A) Asthenic=high Self-confident (S) Nervous=tense (N) Undeterminable (U) ATPD (1) 9 20 5 4 4 PS (2) 2 17 3 7 13 42 BSAD (3) Total Total 42 6 17 15 52 8 16 4 15 9 26 42 126 Source: Frank Pillmann, Raffaela Bloink, Sabine Balzuweit, Annette Haring, and Andreas Marneros, “Personality and Social Interactions in Patients with Acute Brief Psychoses,” Journal of Nervous and Mental Disease,…arrow_forwardA researcher notes that there seems to be a difference in the prevalence of individuals who are medication adherent and have high levels of education along with a high health literacy and the prevalence of individuals who are not medication adherent and have low levels of education along with a low health literacy. Use the appropriate hypothesis to determine if education level and health literacy status are related (independent) at the 5%. Low Level of Education Low Medication Adherence High Medication Adherence Total Low Health Literacy 91 9 100 High Health Literacy 9 291 300 Total 100 300 400 High Level of Education Low Medication Adherence High Medication Adherence Total Low Health Literacy 96 4 100 High Health Literacy 4 296 300 Total 100 300 400arrow_forwardThe director of an obesity clinic in a large northwestern city believes that drinking soft drinks contribute to obesity in children. To determine whether a relationship exists between these two variables, she conducts the following pilot study. Eight- 12-year-old male volunteers are randomly selected from children attending a local junior high school. Parents of the children are asked to monitor the number of soft drinks consumed by their child over a one week period. The children are weighed at the end of the week and their weights converted into body mass index (BMI) values. The BMI is a common index used to measure obesity and takes into account both height and weight. An individual is considered obese if they have a BMI value 30. The following data or collected: child. # of soft drinks consumed BMI 1 3 20 2 1 18 3…arrow_forward
 MATLAB: An Introduction with ApplicationsStatisticsISBN:9781119256830Author:Amos GilatPublisher:John Wiley & Sons Inc
 Probability and Statistics for Engineering and th...StatisticsISBN:9781305251809Author:Jay L. DevorePublisher:Cengage Learning
 Statistics for The Behavioral Sciences (MindTap C...StatisticsISBN:9781305504912Author:Frederick J Gravetter, Larry B. WallnauPublisher:Cengage Learning
 Elementary Statistics: Picturing the World (7th E...StatisticsISBN:9780134683416Author:Ron Larson, Betsy FarberPublisher:PEARSON
 The Basic Practice of StatisticsStatisticsISBN:9781319042578Author:David S. Moore, William I. Notz, Michael A. FlignerPublisher:W. H. Freeman
 Introduction to the Practice of StatisticsStatisticsISBN:9781319013387Author:David S. Moore, George P. McCabe, Bruce A. CraigPublisher:W. H. Freeman