
Concept explainers
Videos
The EPIC-Norfolk study, a study of diet and cancer in Great Britain, was performed to assess the relationship between dietary intake of vitamin C, plasma levels of vitamin C (in blood), and other predictors. One hypothesis is that smokers might have different vitamin C intake and vitamin C plasma levels than nonsmokers. Dietary intake of vitamin C was obtained using 7-day diet records in which a subject recorded what he or she ate in real time and a computer program was used to estimate nutrient intake based on the diet record data. The data in Table 8.40 were obtained for current smokers and nonsmokers.
Table 8.40 Association between current smoking and diet record intake of vitamin C in the EPIC-Norfolk Studya
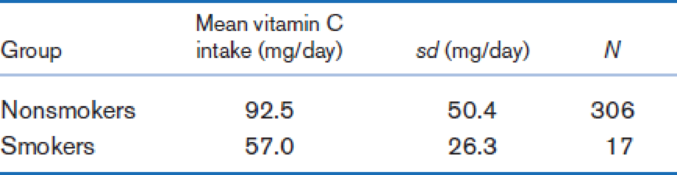
aDiet record intake includes intake from foods but not from vitamin supplements.
Perform the test in Problem 8.168, and identify whether there is a significant difference between the two variances (i.e., is p < .05 or p > .05?).
8.168 What test can be used to compare the standard deviation of diet record vitamin C intake between current smokers vs. nonsmokers?
Want to see the full answer?
Check out a sample textbook solution
Chapter 8 Solutions
Fundamentals of Biostatistics


- A research group is interested in the relationship between exposure to mold in households after a major hurricane and the onset of acute respiratory illness in children. Suppose an observational study is conducted over 10 years following the natural disaster and the following two-by-two table was created in order to address the relationship between exposure and outcome. Acute Respiratory Illness No Acute Respiratory Illness Total Mold 378 156 534 No Mold 73 260 333 Total 451 416 867 Calculate the incidence of acute respiratory illness in the exposed and unexposed. Calculate the relative risk for ARI due to exposure in this study Interpret your findings from part Barrow_forwardDoes this describe an observational study or an experiment? A group of students are told to listen to music while taking a test and their results are compared to a group not listening to music.arrow_forwardFor a variety of reasons, self-reported disease outcomes are frequently used without verification in epidemiologic research. In a study by Parikh-Patel et al. (A-12), researchers looked at the relationship between self-reported cancer cases and actual cases. They used the self-reported cancer data from a California Teachers Study and validated the cancer cases by using the California Cancer Registry data. The following table reports their findings for breast cancer: Cancer Reported (A) Yes No Total Cancer in Registry (B) 2991 112 3103 Cancer Not in Registry 2244 115849 118093 Total 5235 115961 121196 10. 11. Source: Arti Parikh-Patel, Mark Allen, William E. Wright, and the California Teachers Study Steering Committee, “Validation of Self-reported Cancers in the California Teachers Study,” American Journal of Epidemiology, 157 (2003), 539–545. (a) Let A be the event of reporting breast cancer in the California Teachers Study. Find the probability of A in this study. (b)…arrow_forward
- For a variety of reasons, self-reported disease outcomes are frequently used without verification in epidemiologic research. In a study by Parikh-Patel et al. (A-12), researchers looked at the relationship between self-reported cancer cases and actual cases. They used the self-reported cancer data from a California Teachers Study and validated the cancer cases by using the California Cancer Registry data. The following table reports their findings for breast cancer: Cancer Reported (A) Yes No Total Cancer in Registry (B) 2991 112 3103 Cancer Not in Registry 2244 115849 118093 Total 5235 115961 121196 10. 11. Source: Arti Parikh-Patel, Mark Allen, William E. Wright, and the California Teachers Study Steering Committee, “Validation of Self-reported Cancers in the California Teachers Study,” American Journal of Epidemiology, 157 (2003), 539–545. (d) FindðAjBÞ (e) Find PðB j AÞ (f) Find the sensitivity of using self-reported breast cancer as a predictor of actual…arrow_forwardFor a variety of reasons, self-reported disease outcomes are frequently used without verification in epidemiologic research. In a study by Parikh-Patel et al. (A-12), researchers looked at the relationship between self-reported cancer cases and actual cases. They used the self-reported cancer data from a California Teachers Study and validated the cancer cases by using the California Cancer Registry data. The following table reports their findings for breast cancer: Cancer Reported (A) Yes No Total Cancer in Registry (B) 2991 112 3103 Cancer Not in Registry 2244 115849 118093 Total 5235 115961 121196 10. 11. Source: Arti Parikh-Patel, Mark Allen, William E. Wright, and the California Teachers Study Steering Committee, “Validation of Self-reported Cancers in the California Teachers Study,” American Journal of Epidemiology, 157 (2003), 539–545. (g) Find the specificity of using self-reported breast cancer as a predictor of actual breast cancer in the California registry.arrow_forwardA common belief among doctors, nurses and other medical professionals is that lunar cycle influences human behavior, such as the quality of sleep. In a recent study, a scientist was interested in investigating whether there is a significant difference in the number of sleeping hours in different moon phases: waxing crescent, full moon, and waning crescent. Participants’ number hour of sleep were recorded in the table below. Quality of sleeps (in number of hours) Waxing Crescent Full Moon Waning Crescent 7 8 9 7 8 4 5 4 3 6 5 7 8 9 6 What is being measured? That is, what is the DV? What is the level of measurement of the DV? With α = .05, determine whether there are any significant mean differences among your groups.arrow_forward
- When conducting a study with data that is in some way dependent, such as putting the same group of participants through both levels of the dependent variable, researchers use a _____________ design. Question 1 options: Blocked Within-subjects Independent-Samples Circulararrow_forwardRecent research indicates that the effectiveness of antidepressant medication is directly related to the severity of the depression (Khan, Brodhead, Kolts & Brown, 2005). Based on pretreatment depression scores, patients were divided into four groups based on their level of depression. After receiving the antidepressant medication, depression scores were measured again and the amount of improvement was recorded for each patient. The following data are similar to the results of the study. LowModerate HighModerate ModeratelySevere Severe 2.2 1.4 3.4 3.4 1.5 1.4 3.5 2.8 2.8 3.1 2.7 2.3 1.7 2.6 4.4 3.6 1.3 1.5 2.6 3.2 1.3 2.6 2.8 3.5 Fill in the summary table for the ANOVA test: degrees of freedom (d.f.) Sum of Squares (S.S.) Mean Square (M.S.) Between Within Total From this table, obtain the necessary statistics for the ANOVA:F-ratio (F-test statistic): p-value: η2η2 (Eta squared = Sum of squares betweenSum of squares totalSum…arrow_forwardRecent research indicates that the effectiveness of antidepressant medication is directly related to the severity of the depression (Khan, Brodhead, Kolts & Brown, 2005). Based on pretreatment depression scores, patients were divided into four groups based on their level of depression. After receiving the antidepressant medication, depression scores were measured again and the amount of improvement was recorded for each patient. The following data are similar to the results of the study. LowModerate HighModerate ModeratelySevere Severe 2.4 0.2 2.5 3.5 1.6 1.7 2.7 4.3 2.7 3.4 2 3.4 0.5 1.2 5.2 5.1 2.4 2.3 4 3.5 1.8 0.3 4.1 3.8 From this table, conduct an one-way ANOVA. Calculate the F-ratio and p-value. Be sure to round your answers to three decimal places. Assume all population and ANOVA requirements are met.F-ratio: _____p-value: _____What is your final conclusion? Use a significance level of α=0.05. (Select one): There is sufficient evidence that…arrow_forward
- Recent research indicates that the effectiveness of antidepressant medication is directly related to the severity of the depression (Khan, Brodhead, Kolts & Brown, 2005). Based on pretreatment depression scores, patients were divided into four groups based on their level of depression. After receiving the antidepressant medication, depression scores were measured again and the amount of improvement was recorded for each patient. The following data are similar to the results of the study. LowModerate HighModerate ModeratelySevere Severe 0.5 2.7 3.4 2.6 1.7 0.8 2.6 5.3 3.3 1.9 1.1 4 2.6 1.4 4.3 2.6 1.4 2.9 3.6 4.6 3.1 3.2 4.8 1.4 From this table, conduct an one-way ANOVA. Calculate the F-ratio and p-value. Be sure to round your answers to three decimal places. Assume all population and ANOVA requirements are met.F-ratio: p-value:arrow_forwardRecent research indicates that the effectiveness of antidepressant medication is directly related to the severity of the depression (Khan, Brodhead, Kolts & Brown, 2005). Based on pretreatment depression scores, patients were divided into four groups based on their level of depression. After receiving the antidepressant medication, depression scores were measured again and the amount of improvement was recorded for each patient. The following data are similar to the results of the study. LowModerate HighModerate ModeratelySevere Severe 0.3 1.2 2.2 1.8 3.8 1.7 1.4 2.8 3.2 0.4 0.6 2.6 2.3 1.2 1.6 2.6 2 3.2 1.6 2.2 0.6 1.2 1.6 1 2.7 1 2.2 0.6 1.4 1.6 3.3 2.7 2.2 2.9 3.7 2.6 0.9 0.7 3.4 3.1 2.6 1.7 0.8 1.8 2 1.4 1.6 4.1 1.7 0.9 3.3 2.3 1.6 1.1 3.5 1.4 3.5 1.9 0.4 4.2 1.5 2.3 2.2 2.9 1.4 2.2 2.7 2.8 2.1 1.9 1.9 3.9 1.5 2.7 0.8 1.5 1 3 2.1 3.7 1.5 0.9 2.4 1.9 2.7 3.2 0.8 2.7 2.2 2.9 1.8 1.2 2.4 1.7 3.2 1.3 2.2 2.4 1.1 1 2.6 2…arrow_forwardRefer to the data file P08_63.xlsx. SoftBus Company sells PC equipment and customized software to small companies to help them manage their day-to-day business activities. Although SoftBus spends time with all customers to understand their needs, the customers are eventually on their own to use the equipment and software intelligently. To understand its customers better, SoftBus recently sent questionnaires to a large number of prospective customers. Key personnel—those who would be using the software—were asked to fill out the questionnaire. SoftBus received 82 usable responses, as shown in the file. You can assume that these employees represent a random sample of all of SoftBus's prospective customers. SoftBus believes it can afford to spend much less time with customers who own PCs and score at least 4 on PC Knowledge. Let's call these the "PC-savvy" customers. On the other hand, SoftBus believes it will have to spend a lot of time with customers who do not own a PC and score 2 or…arrow_forward
 Glencoe Algebra 1, Student Edition, 9780079039897...AlgebraISBN:9780079039897Author:CarterPublisher:McGraw Hill
 Big Ideas Math A Bridge To Success Algebra 1: Stu...AlgebraISBN:9781680331141Author:HOUGHTON MIFFLIN HARCOURTPublisher:Houghton Mifflin Harcourt